
Seasonal flavors can be your fastest path to incremental revenue—or a quick route to overstock and margin erosion. The difference is rarely the creative idea; it’s the rigor of cohort design and the discipline of KPI measurement. Below is the playbook I’ve used to launch and scale seasonal assortments with fewer surprises and clearer wins.
Phase 1 — Pre-launch planning (2–4 weeks before drop)
I’ve learned the hard way that successful seasonal tests start before the first unit hits the warehouse. Focus on four things.
- Explicit hypotheses
- Example: “Pumpkin Spice 6-pack will achieve ≥65% sell-through in 4 weeks with <2 weeks of supply left at day 28; promo uplift ≤25% of the lift (product appeal first).”
- Data readiness and measurement windows
- Lock how you’ll measure core KPIs and set your windows: pre-launch (−2 to −4 weeks), launch (week 0–4), post-launch (week +5–12). This cadence aligns with observed holiday compression and peak days in 2024 where mobile buying surged and decision windows shortened, as highlighted in the Adobe Digital Insights 2024 season recap (Jan 2025) and the Adobe Cyber Monday 2024 recap.
- Power and sample planning
- Seasonal windows are short. Pre-calc detectable effect sizes and consider sequential testing. If volumes are thin, plan multiple, fast test cycles instead of one big bet—an approach consistent with retail experimentation guidance in McKinsey’s merchandising insights (2025).
- Risk guardrails
- Define open-to-buy buffers, regional inventory caps, and markdown triggers based on WOS and STR thresholds (details below). Note that many teams saw earlier promo ramps and faster time-to-purchase during BFCM 2024, according to Klaviyo’s BFCM 2024 analyses. Your guardrails must assume compressed decision cycles.
Quick pre-launch checklist
- Hypothesis doc approved across merchandising, marketing, and supply chain.
- Measurement plan with KPI formulas and reporting owners.
- Inventory plan with WOS bands and reorder/markdown triggers.
- Test cells, controls, and suppression rules documented.
Phase 2 — Cohort design that ties to operations
Avoid generic “everyone sees everything” launches. Design cohorts you can both market to and supply effectively.
- Seasonal Buyers
- Signals: Purchases cluster in seasonal periods; low off-season activity; frequent seasonal discount code use.
- Actions: Countdown campaigns, bundles, early access. Supply chain: allocate earlier and deeper in regions with high seasonal propensity; set higher safety stock variance.
- Why it matters: Seasonal traffic spikes are real—e.g., US online holiday spend reached $241.4B (+8.7% YoY) in 2024, with mobile dominating peak days, per the Adobe 2024 holiday season recap (2025).
- Promo Responders
- Signals: High promo code redemption, conversions from abandoned-cart discounts, strong promo email clicks.
- Actions: Tiered offers vs value storytelling tests. Supply chain: avoid front-loading inventory if margin sensitivity is high; plan markdown exit ramps.
- Context: BFCM 2024 saw heavy discounting start early in the week, per Klaviyo’s 2024 holiday trends; design your cohorts accordingly.
- High-LTV Loyalists
- Signals: High LTV, frequent purchases, loyalty program activity, subscriptions.
- Actions: Exclusive first taste, VIP bundles, limited preorders. Supply chain: prioritize fill rates and expedited replenishment lanes.
- Event-Driven Cohorts
- Signals: Launch email/site engagement plus purchase timing aligned to event windows.
- Actions: Staged drops, retargeting waves. Supply chain: staggered allocation, dynamic safety stock by event phase.
- Geo/Weather Segments
- Signals: Region, local temperature/rain, distance to fulfillment; past regional seasonal performance.
- Actions: Flavor mix by region; weather‑aware triggers. Supply chain: differentiated safety stock by volatility and lead time. McKinsey’s 2025 retail analyses emphasize agility, segmentation, and nearshoring to reduce variability, reinforcing this approach in the State of Fashion 2025 and related sporting goods trend work.
Cohort hygiene tips
- Enforce unique customer IDs across channels; time-bound exposures to reduce leakage.
- If leakage happens, use intent-to-treat analysis and document the bias. This aligns with experimentation practices summarized by McKinsey merchandising guidance (2025).
Phase 3 — KPIs and formulas you’ll actually use
These are the metrics I monitor for seasonal flavor tests. Formulas align with common ecommerce practice and Shopify’s definitions.
- Sell-Through Rate (STR) = (Units Sold ÷ Units Received) × 100. Use to compare velocity across cohorts/regions. See definitions in Shopify’s KPI guides and retail profitability analysis.
- Weeks of Supply (WOS) = Current Inventory ÷ Average Weekly Sales. Guardrail against over/understock; core to seasonal windows. Reference: Shopify inventory management.
- GMROI = Gross Profit ÷ Average Inventory Cost. Clarifies whether seasonal lift is profitable beyond top-line. See Shopify profitability analysis.
- Promo Conversion Uplift = [(Conversion during promo – Baseline conversion) ÷ Baseline conversion] × 100. Separates promo mechanics from product appeal; see Shopify basic ecommerce metrics.
- Cohort Repeat Rate = Repeat customers in cohort ÷ Total cohort customers × 100. Short/mid-term loyalty signal; see Shopify metrics overview.
- Seasonal Retention Rate = Returning customers in next season ÷ Customers in current season × 100. Track durability of seasonal appeal across drops; concept aligns with Shopify CRM analytics explanations.
- Inventory Turnover (cost or units) = COGS ÷ Average Inventory. Validates velocity and cash efficiency; see Shopify inventory guidance.
Recommended measurement windows
- Pre-launch: capture waitlist signups, notify-me CTR, and forecast locks (−2 to −4 weeks).
- Launch: track STR daily/weekly, WOS trajectory, promo uplift, and cohort repeat within 14/30 days (week 0–4).
- Post-launch: markdown impact, GMROI by SKU, and seasonal retention lead-ins to next drop (week +5–12).
A compact KPI reference
| KPI | Purpose | Decision trigger example |
|---|---|---|
| STR | Velocity vs plan | STR < 30% by day 14 triggers markdown test |
| WOS | Risk of stockout/overstock | WOS < 1.5 in high-propensity regions triggers pull-in |
| GMROI | Profitability quality | GMROI < 1.2 despite high STR prompts price review |
| Promo uplift | Promo dependence | Uplift > 40% suggests product appeal is weak without promo |
| Cohort repeat | Near-term loyalty | Repeat < 12% by day 30 signals flavor fatigue |
Note: Thresholds vary by category; set yours against prior-year seasonal baselines and peer ranges. Many public benchmarks are broad; rigorous internal baselines are more decisive than generic conversion averages, a limitation echoed in open sources.
Phase 4 — Test design patterns that survive reality
- Test vs control structure: Use region/store/channel controls where possible. Keep promo mechanics constant across cells; if not feasible, estimate promo uplift separately.
- Sequential testing for short windows: When volumes are limited, run smaller sequential tests and combine evidence. This reduces underpowered decisions.
- Differences-in-differences: If external shocks (weather, shipping delays) hit one region, compare the change vs a matched control region before and after the event.
- Cannibalization measurement: Track incremental category sales and gross margin, not just SKU-level lift. This is a common blind spot; category view catches substitution effects. See methodology emphasis in McKinsey’s merchandising best practices (2025).
Pitfalls I’ve seen—and fixes
- Cohort leakage: Use strict suppression lists and bounded exposure windows; default to intent-to-treat analysis when leakage occurs.
- Inventory surprises: Monitor WOS daily during week 0–2; set automatic alerts. Flex open-to-buy with expedited lanes for high-performing cohorts.
- Promo bias: Hold promo consistent across test/control. If you must vary, compute uplift cleanly to avoid overstating product appeal.
Phase 5 — Dashboarding and decision cadence
Daily (week 0–2)
- STR by cohort/region, WOS gauge with thresholds, order cycle time, and stockout risk. Add alerting when WOS < 1.5 or STR trajectory misses plan by >10%.
Twice weekly (week 0–4)
- Promo conversion uplift vs baseline; cohort repeat (7/14/30‑day); GMROI trend.
Weekly (week +5–12)
- Markdown impact on GMROI; seasonal retention early indicators; inventory turnover and cash released.
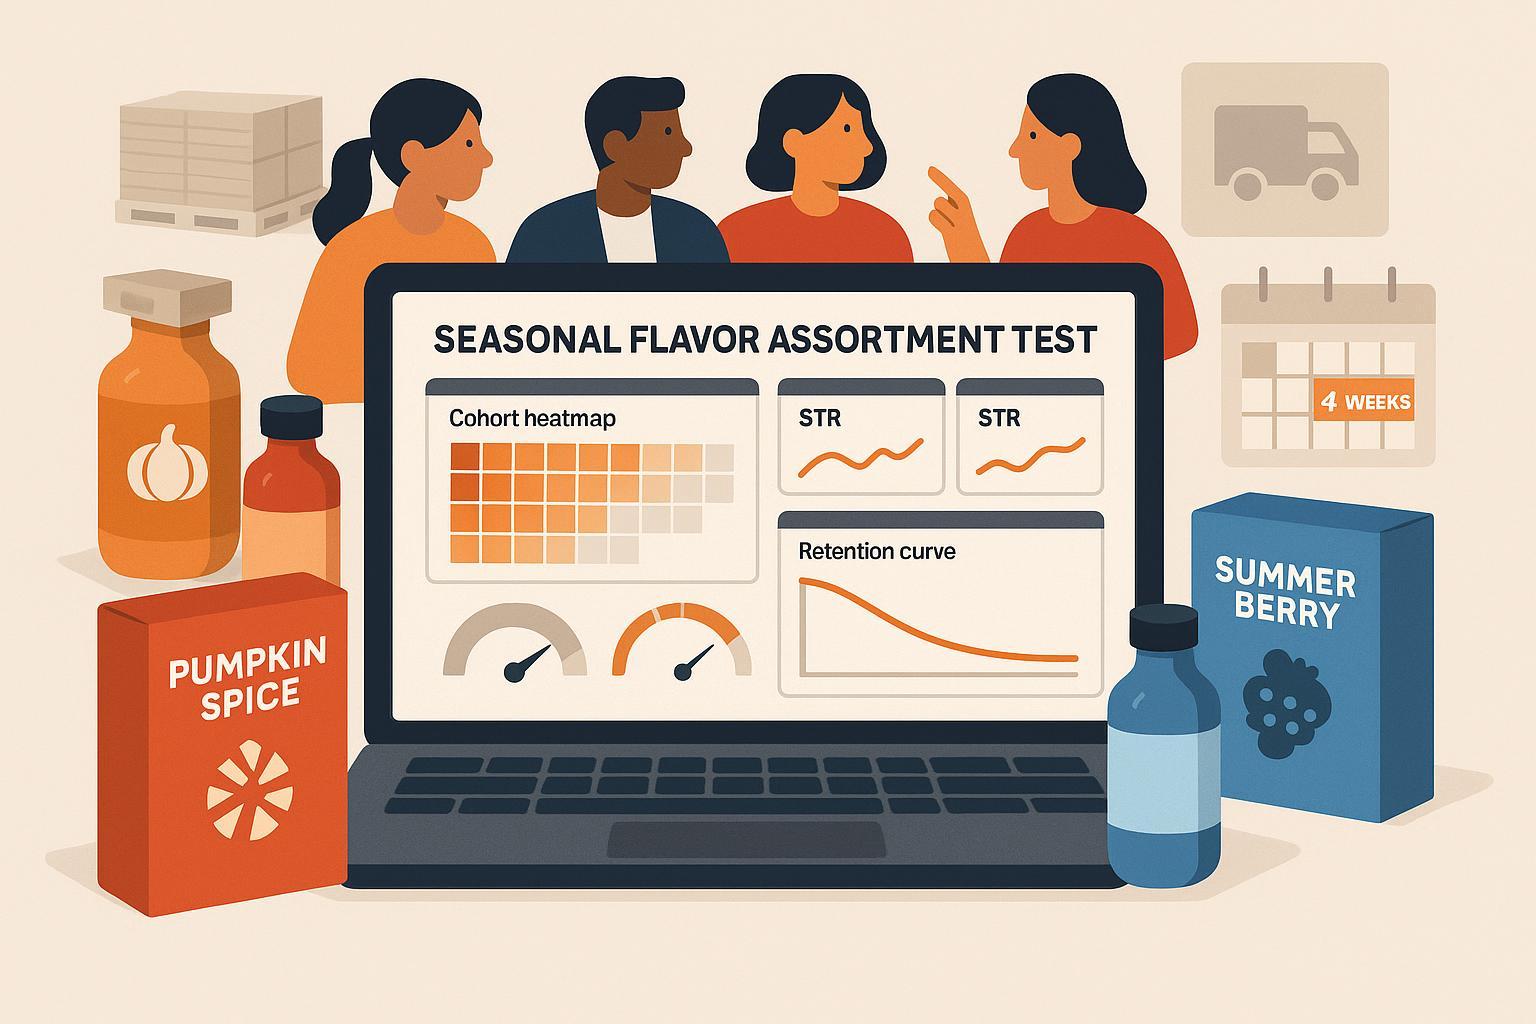
Useful visuals
- Cohort heatmap: rows = acquisition week; columns = weeks since first purchase; values = repeat rate or revenue per buyer.
- STR and WOS time series: show plan vs actual with control bands.
- Retention curves: seasonal cohorts vs core line for context.
If you lack a ready-made template, most BI stacks can replicate these patterns; the component list mirrors standard ecommerce dashboards documented across platform galleries and analytics blogs, consistent with guidance in Shopify KPI resources and related inventory articles.
Phase 6 — Where AI/ML helps (and its limits)
There’s real value in AI-assisted planning, but be specific about use cases and mindful of what’s proven publicly.
- Demand forecasting by cohort: Use cohort propensities (seasonal buyers, promo responders, loyalists) to simulate scenarios and adjust open-to-buy, allocation, and safety stock. Industry discussions about assortment planning underline this linkage between forecasting and breadth/depth decisions, as seen in Leafio’s assortment breadth vs depth overview.
- Decision agility: Segment-level demand sensing and nearshoring can cut lead-time risk and support in-season reallocations, a theme emphasized in the McKinsey State of Fashion 2025.
- Pricing and promo tuning: Real-time pricing models can support better turnover during volatile windows, as outlined in the Harvard Business Review real-time pricing guide (2023).
Be honest about evidence limits
- Public 2023–2025 sources rarely publish quantified seasonal SKU forecast accuracy improvements (e.g., MAPE deltas) from AI. Maintain internal A/B baselines and validate vendors through pilots before scaling.
Toolbox — Assortment test analytics platforms (neutral view)
- WarpDriven — AI-first ERP unifying product, orders, inventory, logistics, finance, and sales with AI agents for recommendations, content automation, predictive analytics, and decisioning; useful when you want cohort-based forecasting and KPI dashboards inside one operational fabric. Disclosure: WarpDriven is the requestor’s platform; evaluate independently.
- Leafio — Demand forecasting and assortment tools with practical dashboards; a fit for mid-market retailers prioritizing straightforward rollout. See its guidance on assortment and forecasting, e.g., the Leafio breadth vs depth article.
- Retalon — Enterprise-grade AI retail analytics covering assortment, demand sensing, price/promo, and inventory optimization; consider for complex omnichannel networks. See the Retalon solutions overview.
Example micro-workflow — Staging a 4‑week seasonal test in an AI‑first ERP
- Define cohorts and guardrails: Seasonal buyers, promo responders, high‑LTV. Set WOS bands (e.g., 1.5–3.0) and markdown triggers.
- Forecast and allocate: Generate cohort‑aware forecasts and allocate by region; monitor STR/WOS daily with alerts.
- Measure and adapt: Track promo uplift separately; if STR < plan and uplift >40%, pivot messaging or move inventory to high‑propensity regions; capture GMROI changes before locking reorders.
Phase 7 — Post‑mortem: Turn learnings into next season’s edge
- Rebuild baselines: Update cohort propensities, STR targets, WOS bands, and GMROI thresholds with actuals from week 0–12.
- Separate product from promo: If uplift carried most of the lift, revisit flavor profile or pack-size options.
- Cannibalization accounting: Compare category gross margin and inventory turnover before vs after the season, not just SKU uplift.
- Operational debrief: Supplier performance, lead-time variance, and logistics constraints—align with the agility recommendations seen in McKinsey’s 2025 retail analyses.
A public LTO note worth remembering
- Chipotle’s “Honey Chicken” LTO reportedly tested into two markets and achieved the highest sales mix among LTOs with incremental transactions, per the QSR Magazine 2025 QSR 50 report. Even without shared exact metrics, the pattern reinforces disciplined testing before broad rollout.
Implementation blueprint you can start this week
- Day 1–2: Lock hypotheses, cohorts, KPIs, and windows; publish the measurement plan.
- Day 3–5: Build dashboards with STR, WOS, GMROI, promo uplift, cohort repeat, seasonal retention; set alert thresholds.
- Week −2: Load inventory with regional allocation based on cohort propensities; confirm guardrails.
- Week 0–1: Monitor STR/WOS daily; hold promo mechanics constant across cells; log any deviations.
- Week 2–4: Trigger reallocations or markdown micro-tests per thresholds; review retention and repeat by cohort.
- Week 5–12: Close the loop—GMROI and markdown impact; plan the next seasonal drop with updated baselines.
Soft next steps
If you’re evaluating platforms for this workflow, run a 30‑day pilot with your next drop: define two cohorts, wire KPIs, and pressure‑test alerting, forecasting, and reallocation rules end‑to‑end.