
Promotions can supercharge revenue—and wreck your LTV forecast. If your CFO is asking why the CAC/LTV math just blew up, this guide walks you through a practical, AI-assisted playbook to diagnose the break, quantify impact, choose the right fix, and prevent repeats.
- Difficulty: Intermediate to advanced (analytics/ML familiarity helps)
- Time required: 2–8 hours for initial diagnosis; 1–2 sprints for full remediation
- What you’ll achieve: A reproducible workflow to pinpoint root causes, recalibrate or re-model, and set guardrails (drift/change-point) so the next promo doesn’t surprise you.
Step 1: Define the break and quantify the gap
Before diving into fixes, define exactly how and where the forecast failed.
Do this:
-
Fix the horizon and unit
- Choose the LTV horizon (e.g., 90 or 180 days) and unit (net revenue or gross margin per customer). Keep it consistent across cohorts.
-
Calculate forecast error by cohort
- Prefer WAPE (aka wMAPE) over MAPE to avoid instability on small actuals. WAPE = sum(|A − F|) / sum(A). If you do use MAPE, note it is sensitive to near-zero actuals, as the Mean absolute percentage error entry explains.
-
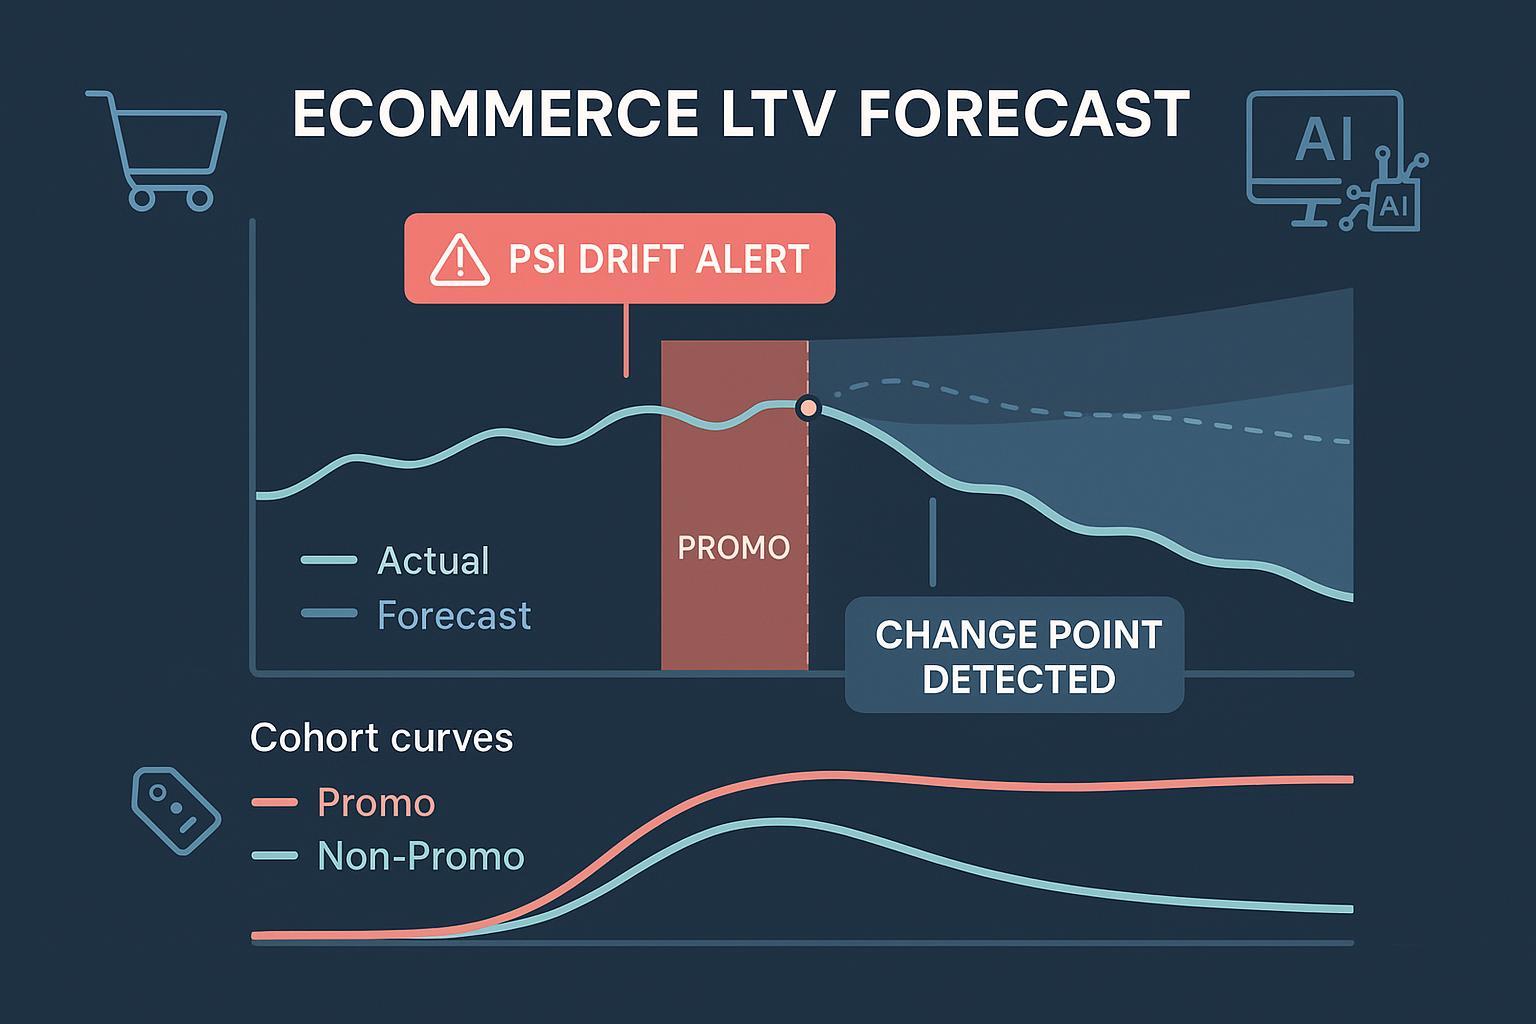
Compare pre- vs post-promo
- Plot forecast vs actual by cohort age. Highlight the promo start date. Show the error delta before, during, and after the promo window.
-
Localize the failure mode
- Is it frequency (orders per customer), value (AOV), mix (discount-heavy products), or retention/return rates? Tag the metric where the divergence starts.
Verification gate
- You should have a single chart per cohort showing predicted vs realized cumulative revenue and a table of WAPE/MAPE by cohort and week. If you can’t localize the divergence to a metric and time window, don’t proceed—collect this first.
Step 2: Run rapid data QA (rule out plumbing issues)
Most “broken model” incidents are data issues after a promo spike. Rule those out fast.
High-ROI checks:
-
Refunds and returns latency
- Many refunds arrive days or weeks later and must offset revenue. Reconcile refund objects and statuses before computing LTV. Shopify’s Admin GraphQL docs detail refunds and returns workflows in 2025, including the Refund object and return management. Ensure you’re using net revenue (after refunds and discounts).
-
Order status filters
- Exclude canceled/voided orders, and handle partially refunded states consistently. See the 2025 Shopify Orders query and Liquid order object for the authoritative status fields to trust.
-
Promo code tagging and discount math
- Validate that discount codes and automatic discounts are captured on the order/line items; use subtotal_after_discounts or equivalent fields. Time-zone normalize promo windows.
-
Attribution windows (GA4)
- Misconfigured lookback windows double-count or mis-attribute promo conversions. Review the 2024–2025 GA4 attribution models overview and lookback window settings. Align your acquisition cohorts to the same windows used in LTV labels.
-
Duplicates and ingestion delays
- Promo spikes cause retries and late events. De-duplicate by customer_id, timestamp proximity, amount, and idempotency keys; confirm data latency SLAs.
Helpful SQL snippets
-- Refund latency outliers (adjust threshold as needed)
SELECT order_id, customer_id, order_date, refund_date,
       DATEDIFF(refund_date, order_date) AS refund_latency_days
FROM fact_orders
WHERE refund_date IS NOT NULL
  AND DATEDIFF(refund_date, order_date) > 14;

-- Promo tagging sanity: orders without expected discount fields
SELECT order_id, customer_id, order_date, discount_code, auto_discount_applied, subtotal, total
FROM fact_orders
WHERE order_date BETWEEN '2025-08-01' AND '2025-09-01'
  AND (discount_code IS NULL AND auto_discount_applied = FALSE)
  AND marketing_campaign = 'Labor Day 30%';

-- Duplicate detection under load (heuristic)
WITH candidates AS (
  SELECT customer_id, order_amount, order_ts,
         LAG(order_ts) OVER (PARTITION BY customer_id, order_amount ORDER BY order_ts) AS prev_ts
  FROM fact_orders
)
SELECT *
FROM candidates
WHERE prev_ts IS NOT NULL AND TIMESTAMPDIFF(MINUTE, prev_ts, order_ts) <= 5;
Verification gate
- Reconciliation passes: net revenue in your warehouse matches finance ledgers within tolerance; refund posting latency is accounted for; attribution windows are consistent; no spikes from duplicates. If not, fix pipeline issues before touching the model. For broader hygiene and forecasting context, see Segment’s 2023–2025 guidance on data hygiene and the SQL-focused primer Forecast with SQL.
Step 3: Split cohorts and visualize behaviors
If data checks out, decompose the problem. Promotions often change who you acquired and how they behave.
Segment by:
- Acquisition date cohort and cohort age (x-axis)
- Promo exposure (binary or intensity like discount percent)
- Channel/source (paid social, search, email, affiliates)
- New-to-file vs returning
- First product category or price band
- Discount depth (e.g., 10%, 30%, BOGO)
- Region/currency (normalize FX by transaction date)
Plot these:
- Cumulative revenue per customer by cohort age
- Repeat purchase rate and interpurchase time
- AOV by cohort age (net of discounts and refunds)
- Refund-adjusted net orders per customer
Tip
- Use cohort age on the x-axis to normalize timing across cohorts. Templates from Amplitude (2023–2025) and Mixpanel are helpful starting points: the Amplitude cohort analysis dashboard template and Mixpanel cohorts docs.
What to look for
- Promo-acquired cohorts showing lower repeat rates or lower AOV bands than historical ranges
- Channels with extreme “new-to-file” shares during the promo
- A visible change-point in interpurchase times around promo start
Verification gate
- You can isolate which cohorts and channels drove most of the forecast error and whether the issue is frequency, value, or both. If you cannot, revisit segmentation granularity.
Step 4: Check for non-stationarity and drift (AI-assisted)
Promotions often violate core assumptions in customer-base models (CBM). BG/NBD assumes stationary purchase rates and dropout processes; Gamma-Gamma assumes monetary value independent of purchase frequency. Bruce Hardie’s 2019 derivation and notes are the canonical reference for these assumptions: see the 2019 BG/NBD derivation and the Gamma-Gamma overview in Hardie’s Gamma-Gamma model note.
Run these checks:
-
Data drift on key features
- Track discount rate, new-to-file rate, interpurchase time distribution, AOV, product mix. Compute PSI or KL divergence vs. a pre-promo baseline. Evidently AI’s 2023–2025 resources explain thresholds and dataset-level drift, e.g., the guide on data drift in large datasets and the overview of concept drift.
-
Prediction/output drift
- Even before labels mature, monitor predicted LTV distribution shifts relative to training-time calibration bands. Evidently’s ML monitoring metric guides (2023–2025) detail output drift and calibration monitoring.
-
Change-point detection around the promo
- Apply offline methods like CUSUM or the Ruptures library to detect structural breaks in features (discount%, AOV) and outputs (predicted LTV). The Ruptures project documentation (2020–) provides tutorials: see the Ruptures library docs.
Interpretation tips
- PSI < 0.1 often suggests no drift; 0.1–0.2 moderate; ≥0.3 significant—but calibrate thresholds to your historical variability per Evidently’s guidance.
- Confirm that drift aligns temporally with the promo window and impacted cohorts. That strengthens the case for concept drift rather than data errors.
Verification gate
- You have at least one objective drift or change-point signal on a promo-adjacent feature or on the model outputs. If not, the issue might be limited to a specific cohort mix or a narrow data mislabeling.
Step 5: Diagnose selection bias and mix shift
Promos often pull in price-sensitive, lower-retention buyers, creating a selection bias that drags aggregate LTV. Marketing science has long emphasized heterogeneity and retention’s impact on value; see Gupta, Lehmann, and Ames (2004) for a foundational discussion in the Journal of Marketing Research on valuing customers.
Do this:
- Quantify “new-to-file” share and compare to pre-promo
- Compare repeat rate and AOV for promo-acquired vs non-promo cohorts
- Use price-sensitivity proxies (discount depth, category mix, use of coupon sites)
- Estimate a propensity model for promo exposure and consider inverse propensity weighting (IPW) when assessing baseline LTV
Decide:
- Maintain separate baselines and models for promo-acquired cohorts
- Or include promo/channel covariates so the model learns cohort-specific dynamics
Verification gate
- You can articulate whether the LTV break is a cohort mix issue, a behavioral shift within cohorts, or both, with quantified deltas.
Step 6: Choose your fix — recalibrate, re-segment, or re-model
Map findings to an appropriate remedy.
Option A: Recalibrate parameters on recent windows
- If drift is moderate and behavior likely reverts, re-estimate parameters on a rolling window that includes post-promo data.
- For monetary value, reassess the Gamma-Gamma independence assumption; discounting can induce frequency–value correlation, which Hardie’s Gamma-Gamma note describes as a key assumption to validate.
Option B: Expand the model with covariates
- Add time-varying covariates: discount intensity, channel, seasonality flags, promo indicators. Extend CBM (e.g., BG/NBD with covariates) or use survival/transaction models that handle covariates.
Option C: Segment models
- Train distinct models for promo-acquired vs non-promo cohorts (or hierarchical models with cohort-level effects). This reduces bias from pooled assumptions.
Option D: Short-term overlay while retraining
- Apply a temporary calibration factor per affected cohort (e.g., scale predicted LTV by recent realized/predicted ratios) while the full retrain validates.
Operational guidance
- Backtesting and holdouts: Replay prior promos as “what-if” validations. Use cohort/time-based holdouts.
- Stability checks: Ensure parameter estimates are stable across folds; watch for overfitting to the promo window.
- Documentation: Record assumptions, covariates added, and recalibration triggers for future audits.
Verification gate
- Pass quantitative thresholds: per-cohort WAPE back within tolerance, acceptable calibration plots (predicted vs realized cumulative revenue), and no unexplained residual drift signals.
Step 7: Validate, redeploy, and set guardrails
Before pushing updates to production, close the loop with strict checks.
-
Backtest on at least one prior promo period
- Ensure the new approach handles promo-induced shifts without degrading non-promo periods.
-
Calibration and error thresholds
- Set go/no-go criteria by cohort and channel (e.g., WAPE ≤ 15% for top-5 acquisition channels at 90-day horizon).
-
Monitoring in production
- Track feature drift (discount rate, NTF rate, AOV), output drift, and error once labels accrue. Evidently AI’s monitoring references (2023–2025) provide practical metric suites for data drift and concept drift.
-
SLAs and alerts
- Establish SLAs for refund/return posting latency and data ingestion. Create change-point alerts around known promo start dates.
-
Communication
- Summarize what changed, impact size by cohort, and policy recommendations (e.g., separate CAC targets for promo-acquired users, throttle discount depth for certain channels).
Verification gate
- A signed-off deployment checklist: backtests passed, calibration stable, monitors live, alert thresholds agreed, and documentation shared with Finance/Growth.
Toolbox: Data, Analytics, and Monitoring Stack (neutral)
Choose tools that make it easy to integrate commerce data, transform and model it, and monitor for drift/change points. Evaluate on connectors, governance, cost, learning curve, and monitoring depth.
-
Data warehouse and transforms
- Snowflake or BigQuery with dbt for versioned SQL transformations and tests. See Google’s BigQuery and dbt’s configuration checklist.
-
Customer data and analytics
- Segment for unified profiles and SQL-friendly forecasting workflows; see the guide Forecast with SQL.
- Mixpanel or Amplitude for cohort/retention analysis; start with the Amplitude cohort dashboard template.
-
ERP/commerce operations and analytics
- WarpDriven — an AI-first ERP/analytics platform that can unify orders, inventory, and predictive workflows across channels. WarpDriven. Disclosure: WarpDriven is our product. Use it alongside a warehouse and monitoring to centralize promo data, automate reconciliations, and feed LTV models.
- Alternatives: consider your incumbent ERP or analytics layer; evaluate on data model flexibility, connector coverage, and monitoring integration.
-
ML observability and drift detection
- Evidently AI for open-source and enterprise drift/calibration suites; start with the guides on data drift at scale.
- WhyLabs, Arize AI, or Fiddler AI for managed observability platforms.
Keep mentions neutral—pick what fits your stack and team skills. Avoid lock-in by separating storage (warehouse), transforms (dbt/SQL), analytics apps, and monitoring.
Troubleshooting FAQ (edge cases)
-
Heavy returns spike after promo
- Expect net revenue to drop as refunds post. Ensure refund objects are fully reconciled and late postings are modeled. Shopify’s 2025 docs specify refund and return data structures; see the Refund object and return management.
-
Subscriptions or contractual products
- Promotions may alter churn hazard or upgrade/downgrade rates. Use subscription-appropriate models (e.g., BG/BB or survival/Cox with time-varying covariates). Validate with randomized or quasi-experimental designs when available.
-
Marketplaces and cross-border
- Normalize currencies by transaction date FX; align tax/duty handling; adjust for marketplace fee structures that affect net revenue.
-
Short label windows
- If you cannot observe long-horizon LTV yet, rely on output drift and short-horizon calibration (e.g., 30/60-day realized vs predicted) while longer windows mature.
Playbook: Copy/paste checklist
Use this as your incident runbook after every major promo.
- Define the incident
- Fix horizon, unit (net revenue or margin), and affected cohorts
- Compute WAPE/MAPE by cohort and week; chart predicted vs realized cumulative revenue
- Data QA (stop the line if any fail)
- Refund/return reconciliation passes; statuses consistent
- Promo tags and discount math verified; time zones aligned
- GA4 attribution windows confirmed and consistent
- Duplicates removed; data latency within SLA
- Cohort decomposition
- Segment by promo exposure, channel, new-to-file, category, discount depth, region
- Plot cumulative revenue, repeat rate, AOV by cohort age; compare against historical bands
- Drift and change points
- Compute PSI/KL on key features vs pre-promo baseline
- Monitor predicted LTV distribution drift; run change-point detection around promo start
- Selection bias and mix shift
- Quantify NTF share changes; compare repeat/AOV for promo vs non-promo cohorts
- Decide on separate models or covariates; consider IPW for baseline estimates
- Fix and validate
- Recalibrate, re-segment, or re-model; add time-varying covariates
- Backtest on prior promos; set per-cohort WAPE and calibration thresholds
- Deploy and guardrail
- Monitors and alerts live (feature drift, output drift, change points)
- SLAs documented; finance alignment on policy changes (e.g., CAC targets by cohort)
Why this happens: a quick model note (for context)
Classic customer-base models such as BG/NBD and Gamma-Gamma assume stationarity and, for value, independence between purchase frequency and monetary value. Promotions can break both: they change purchase timing and induce a correlation between frequency and AOV via discounting. For a rigorous treatment, consult Bruce Hardie’s 2019 BG/NBD derivation and his Gamma-Gamma model note. For monitoring deployed models through non-stationarity, see Evidently AI’s 2023–2025 overviews of data drift and concept drift.
Verify you fixed it (what good looks like)
- Per-cohort WAPE back within tolerance for top channels and cohorts
- Calibration plots show predicted and realized cumulative revenue aligned within bands across cohort ages
- No significant drift alerts on core features post-deployment; any residual drift is explained by intentional promo mix
- Finance and Growth agree on separate targets or covariates for promo-acquired customers
If you can check these boxes, your LTV forecast is back under control—and better prepared for the next promotion.