
If you’re building a marketplace, your survival hinges on two things: how efficiently buyers and sellers find each other (liquidity) and how predictably you monetize those transactions (take rate). The dashboards that operators actually use are the ones that guide daily actions, not just report yesterday’s numbers. This playbook distills field-tested patterns you can implement this week.
Quick‑Start Checklist (run this in the next 10 days)
- Define the minimum viable KPI set: match rate, time‑to‑match, sell‑through, buyer:seller ratio, utilization, GMV, and take rate.
- Lock formulas and grain (e.g., order‑level vs. request‑level). Publish definitions alongside the dashboard.
- Pipe core events: listing_created, search/view, request/intent, transaction, cancel/stockout, refund, fee_accrued.
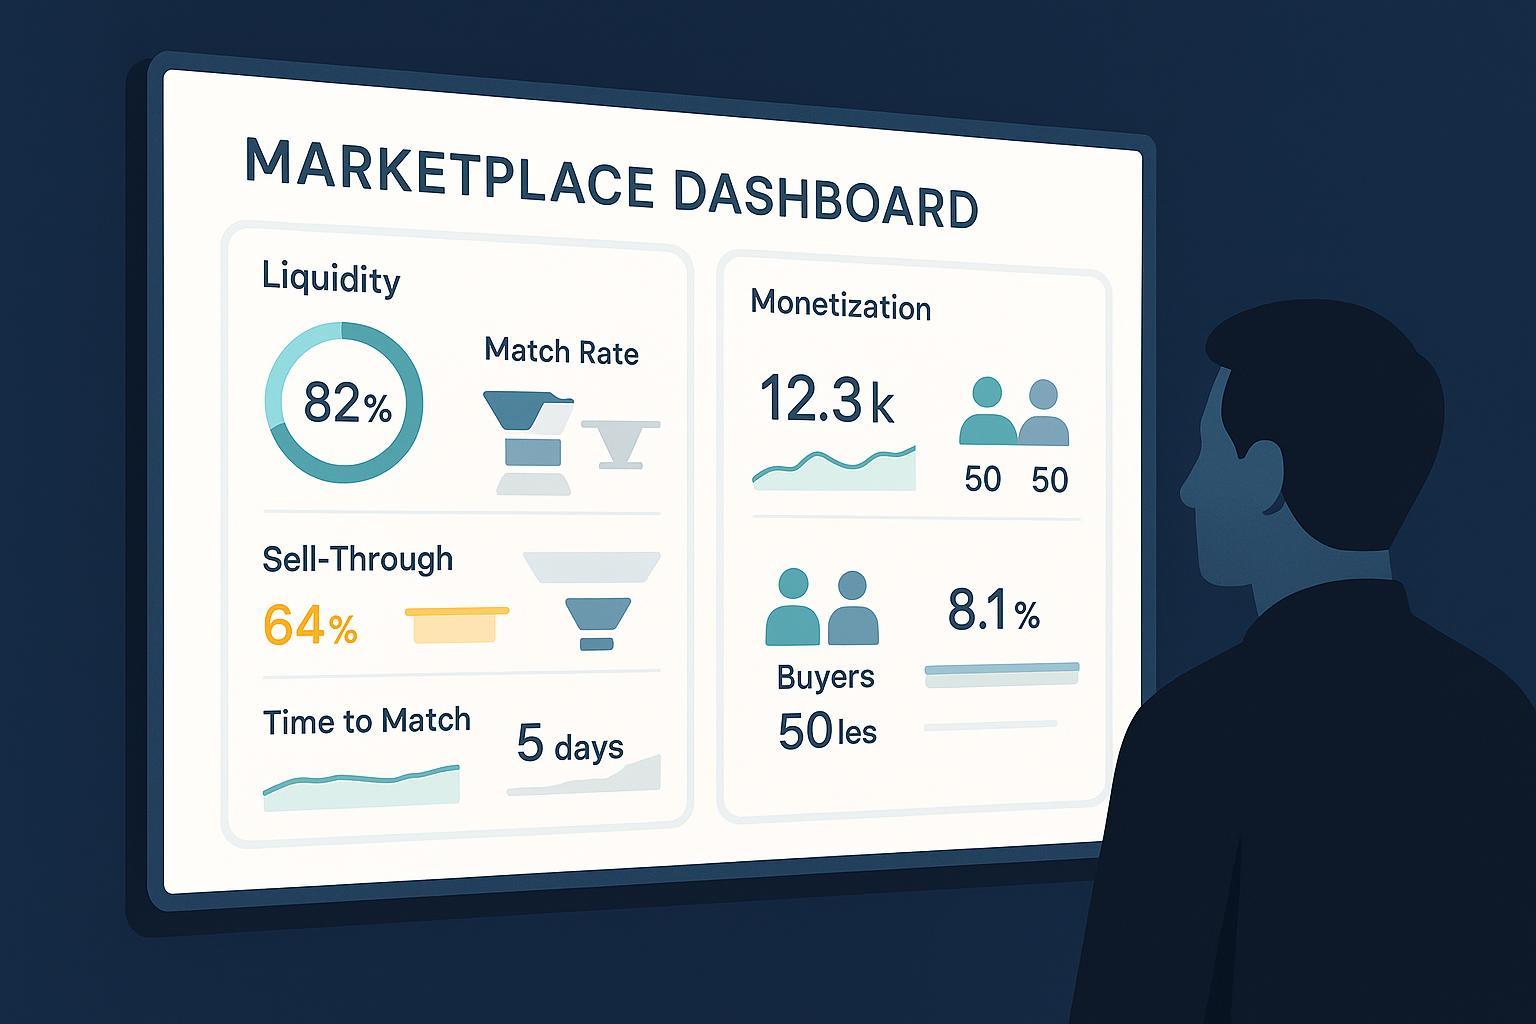
- Above the fold: top 5 KPIs with 8–12‑week trend lines and target bands. Owner names beside each KPI.
- Alerts: seasonality‑aware thresholds (e.g., ±2.0σ vs. trailing median), routed to Slack/Email with a remediation playbook link.
- Cadence: 15‑minute daily ops huddle; weekly category health review; monthly take‑rate and leakage review.
- Act fast on imbalances: queues, pricing nudges, supply boosts, or demand shaping within 24 hours of alerts.
What “liquidity” and “take rate” actually mean (and the exact formulas)
Liquidity is the ease and speed with which your marketplace converts intent into completed transactions. Practically, founders track match rate, sell‑through (or fill rate), time‑to‑match, buyer:seller ratio, and utilization. This framing aligns with the operator guidance in Sharetribe Academy’s marketplace metrics.
Core formulas you can standardize:
- Match Rate = Successful Transactions ÷ Buyer Requests
- Time‑to‑Match = Avg. Time from Request to Transaction Completion
- Sell‑Through = Listings Sold ÷ Total Listings in Period
- Buyer:Seller Ratio = Active Buyers ÷ Active Sellers
- Utilization = Active Supply (or Sold Inventory) ÷ Total Supply
- GMV = Σ Transaction Values
- Take Rate = Marketplace Revenue ÷ GMV
These definitions are consistent across 2024–2025 operator sources such as Markko’s 14 marketplace metrics and B2B KPI glossaries like VirtoCommerce’s essentials.
Why it matters: Liquidity metrics reflect product‑market fit and matching quality; take rate reflects monetization strategy and unit economics. Over‑optimizing either side in isolation can stall growth. Phoenix Strategy Group’s KPI overview emphasizes a balanced set for VC‑backed marketplaces in 2024–2025, avoiding single‑metric tunnel vision (10 marketplace KPIs).
Dashboard architecture that drives action (not screenshots)
- Modeling and grain:
- Use a normalized event model with clear entity keys (buyers, sellers, listings, requests, orders). Decide whether “request” or “listing view” is the funnel’s top event.
- Build derived tables for liquidity and monetization at daily grain with category and geography dimensions.
- Visual hierarchy:
- Put the top‑five KPIs above the fold with consistent colors and units. Use trends for GMV/take rate, funnels for search→request→transaction, and distributions for time‑to‑match. UI/UX guidance such as Justinmind’s dashboard best practices helps maintain clarity.
- Performance and interaction:
- Keep tiles performant, cache heavy queries, and expose filters for category, geography, and cohort. Follow patterns from Google Looker’s performant dashboards.
- Ownership:
- Assign a KPI owner and a playbook for each alert. If “Match Rate – Rides” drops 10% WoW, the playbook might add surge/discounts, re‑rank supply, or temporarily throttle new buyer acquisition in that zone.
The liquidity metrics that actually move the needle
Below are the metrics I’ve seen founders rely on to make weekly decisions. Benchmarks vary by category and stage; treat these as directional and validate against your own cohorts.
1) Match rate
- Definition: % of buyer intents (requests) that result in completed transactions.
- Why it matters: Measures matching efficiency and marketplace fit.
- Benchmarks: Seed often sees 20–40%; growth targets 40–60%+ in top categories, depending on complexity. Sharetribe and Markko position match/sell‑through as core liquidity indicators (Sharetribe metrics; Markko metrics).
- Alert triggers: −10% vs. trailing 8‑week median; category outliers >2σ below portfolio median.
- Immediate actions:
- Boost supply density (targeted invites/discounted seller fees) in affected micro‑markets.
- Nudge ranking toward availability/response‑time.
- Improve request quality (structured fields, price hints) to reduce mismatches.
Common trade‑offs: Aggressive take‑rate hikes can depress match rate short‑term; batching requests can improve fill but increase time‑to‑match.
2) Sell‑through (fill rate)
- Definition: % of listings sold in the period.
- Why it matters: Seller‑side liquidity and inventory quality proxy.
- Benchmarks: Mature B2C categories often aim for 60–70%+; early stages commonly run 30–50% while you shape supply quality (Sharetribe metrics; VirtoCommerce KPI ranges).
- Alerts: Drop below target band for two consecutive weeks; category spread widening.
- Immediate actions:
- De‑list or down‑rank stale inventory; enforce better content standards.
- Introduce dynamic pricing suggestions or bundles.
- Activate onsite merchandising for high‑intent queries.
Pitfalls: Counting “views” as supply. Keep denominator grounded in active, discoverable listings.
3) Time‑to‑match
- Definition: Avg. time between request and transaction completion.
- Why it matters: Directly tied to conversion and NPS; impacts repeat behavior.
- Ranges: Hours to days in B2C goods; days to weeks in B2B services (CS‑Cart metric overview).
- Alerts: +20% WoW or breach of SLO (e.g., >24h in priority categories).
- Immediate actions:
- Auto‑route new requests to available supply; widen geo radius.
- Incentivize fast responders; adjust service windows.
Trade‑off: Over‑favoring “speed” can compromise quality if vetting falls behind.
4) Buyer:Seller ratio
- Definition: Active buyers per active seller over a period.
- Why it matters: Structural balance indicator; too few buyers leads to idle sellers; too many buyers creates stockouts and long queues.
- Directional healthy ranges: ~1:1 to 3:1 depending on category complexity (Sharetribe liquidity framing).
- Alerts: Two‑week run outside bands in top categories; rapid drift after a marketing push.
- Immediate actions:
- If buyer‑heavy: onboard more sellers, loosen vetting temporarily, or increase assortment.
- If seller‑heavy: boost demand with targeted promos or partnerships.
5) Utilization
- Definition: % of supply actively transacting (or % of inventory sold) in the period.
- Why it matters: Reveals idle capacity and where liquidity is trapped.
- Alerts: High seller churn alongside low utilization; geographic clusters of idle capacity.
- Immediate actions:
- Rebalance ranking toward idle but qualified supply.
- Expand catalog mappings to expose more inventory to discovery.
Monetization metrics: take rate, GMV, and contribution margin
- Take rate (Revenue ÷ GMV) is your monetization lever. Typical ranges differ by model: services marketplaces often run 15–30%, while goods marketplaces tend to sit lower due to price sensitivity and competition. For context, public filings show Fiverr’s 27.6% marketplace take rate (TTM to Q2 2025). In accommodation, fee structures are split; for example, Airbnb details host 3–4% and guest ~14–16.5% fee ranges in its help center (2024–2025).
- GMV trend should be read with take‑rate bps changes, returns, and incentives to understand revenue yield.
- Contribution margin per order clarifies unit economics after variable costs (payment, support, risk, fulfillment). Track it by category and acquisition channel.
Leakage control: measure off‑platform communication rates, refund/chargeback rates, and cancellation reasons. Small reductions can raise effective take rate without touching headline fees.
Market context: B2B marketplaces are expanding rapidly; U.S. cohorts continue to scale into 2025, as summarized in Digital Commerce 360’s 2024 B2B marketplace growth reporting, which provides context for achievable GMV trajectories.
Review cadences and seasonality‑aware alerting
- Daily (15 minutes):
- Liquidity deltas vs. 8–12‑week baseline; backlog; cancellations/stockouts.
- Owner confirms or dismisses alerts with a note.
- Weekly (60 minutes):
- Category leaderboard for match rate/sell‑through/time‑to‑match; top anomalies and post‑mortems.
- Experiment updates: fee tests, ranking changes, supply programs.
- Monthly/Quarterly:
- Take‑rate strategy, leakage review, contribution margin by category, and cohort LTV/CAC.
Alerting setup Use rolling medians and seasonality bands; don’t alert on natural weekly cycles. Route actionable alerts to the right owner with context, as in BI guidance from Saras Analytics on eCommerce dashboards and Looker’s alerting/performance best practices.
Stage‑based focus and common trade‑offs
- Seed (finding liquidity):
- Priorities: time‑to‑first‑transaction, match rate on top category, early sell‑through, and activation rates.
- Trade‑offs: Temporarily subsidize one side; accept higher support costs to accelerate learning velocity.
- Growth (balancing at scale):
- Priorities: reduce time‑to‑match, push sell‑through past 50–70% in hero categories, improve repeat rates, and begin fee tests without hurting conversion.
- Trade‑offs: Ranking for speed vs. quality; broader assortment vs. curation.
- Mature (durability and margin):
- Priorities: stabilize liquidity, optimize take rate (fee/discount tests), reduce leakage, increase LTV/CAC.
- Trade‑offs: Maximizing near‑term take rate vs. long‑term retention and ecosystem health.
This lifecycle framing echoes operator guidance from Sharetribe on PMF and liquidity and B2B KPI priorities in VirtoCommerce’s KPI guide.
AI and automation: where it helps versus hype
Practical wins I’ve seen:
- Forecasting: Category‑level liquidity forecasts inform staffing and promo calendars.
- Anomaly detection: Uncovers silent failures (e.g., a connector partial outage) faster than manual monitoring.
- Dynamic routing and pricing suggestions: Shorten time‑to‑match and lift sell‑through when supply is thin.
Evidence on magnitude varies by vertical. Industry roundups report meaningful conversion uplifts from AI‑powered discovery and automation, but effects are context‑dependent. Use them as directional inputs, not guarantees—for example, 2024–2025 surveys and vendor studies summarized in MissionCloud’s AI statistics (2025) and applied marketplace guides such as Origami Marketplace’s AI applications.
Toolbox: getting this live (neutral picks)
- WarpDriven — AI‑first ERP for eCommerce and supply chains; unifies orders, listings/inventory, logistics, and finance with AI agents for forecasting and decision support. Public pages emphasize real‑time operations; specific dashboard templates/SLAs are not detailed. Disclosure: WarpDriven is our product.
- Shiny (R) — Highly customizable analytics apps; strong for bespoke liquidity funnels if you have R expertise. Requires engineering and DevOps for scale and alerting.
- Brex — Financial platform with real‑time spend/treasury visibility. Useful for founder dashboards tying take‑rate revenue to cash and runway; not a marketplace‑specific BI.
- Markko — Marketplace metrics knowledge base and lightweight analytics framing; helpful for standardizing definitions and KPI taxonomies.
Choose based on: need for operational integration (ERP depth), customization appetite (code vs. no‑code), alerting requirements, and your team’s technical stack.
Workflow micro‑example: tracking liquidity via WarpDriven
- Connect channels (e.g., storefronts, payment gateway, fulfillment) and define event mappings: request, order, refund, fee.
- Standardize KPIs (formulas above) and create a “Liquidity” board with match rate, sell‑through, time‑to‑match, and buyer:seller ratio by category.
- Configure seasonality‑aware alerts on rolling medians (e.g., match rate −10% vs. 8‑week baseline) routed to owners.
- Add a “Monetization” tab with GMV, take‑rate bps, refunds, and contribution margin.
- Limitation to plan for: template and alerting specifics may require configuration and data modeling to reflect your taxonomy and SLAs.
Founder notes and myth‑busting
- Conversion work compounds: A UK auto repair marketplace reported +60% revenue in two months by combining pricing and transparency changes, with +10–15% conversion gains traced to profile transparency and landing page redesigns (see the Unbounce repository of conversion case studies, 2024–2025). These improvements raise GMV and can indirectly strengthen effective take rate.
Myths to retire:
- “More buyers always fix liquidity.” Not if supply quality, availability windows, or response times are the bottleneck.
- “Raise take rate, raise revenue.” Only if conversion and leakage remain stable; otherwise GMV can drop faster than yield improves.
- “Dashboards must be comprehensive.” The best ones are ruthlessly narrow, owned, and tied to playbooks.
Glossary (keep these precise)
- Liquidity: Ease/speed of converting intent to transactions; proxied by match rate, sell‑through, time‑to‑match, utilization.
- Match Rate: % of buyer requests that result in completed transactions.
- Sell‑Through (Fill Rate): % of listings sold in a given period.
- Time‑to‑Match: Avg. time from request to transaction completion.
- Buyer:Seller Ratio: Active buyers divided by active sellers.
- Utilization: % of supply actively transacting (or % inventory sold).
- GMV: Sum of transaction values over a period.
- Take Rate: Marketplace revenue divided by GMV.
- Contribution Margin per Order: Revenue minus variable costs for that order (fees, logistics, fraud, support).
Implementation checklist recap
- Decide on grain and definitions; publish them.
- Build a Liquidity and a Monetization board; 5 KPIs above the fold.
- Wire seasonality‑aware alerts with owners and playbooks.
- Run the daily/weekly/monthly cadence—religiously.
- Add AI where it reduces time‑to‑match or detects anomalies faster than humans.
- Review fee tests and leakage monthly; optimize for durable take‑rate bps, not short blips.
For broader market context and KPI prioritization, cross‑reference 2024–2025 operator resources like Sharetribe’s marketplace metrics, Phoenix Strategy Group’s KPI guide, and Digital Commerce 360’s B2B marketplace reports.