
Build a working pipeline that converts plain-English questions into validated Vega-Lite chart specifications and renders them in a governed dashboard. Expect 1–2 days for a prototype and 2–6 weeks to productionize with guardrails, depending on your data model maturity.
- Difficulty: Intermediate (data/BI engineering familiarity assumed)
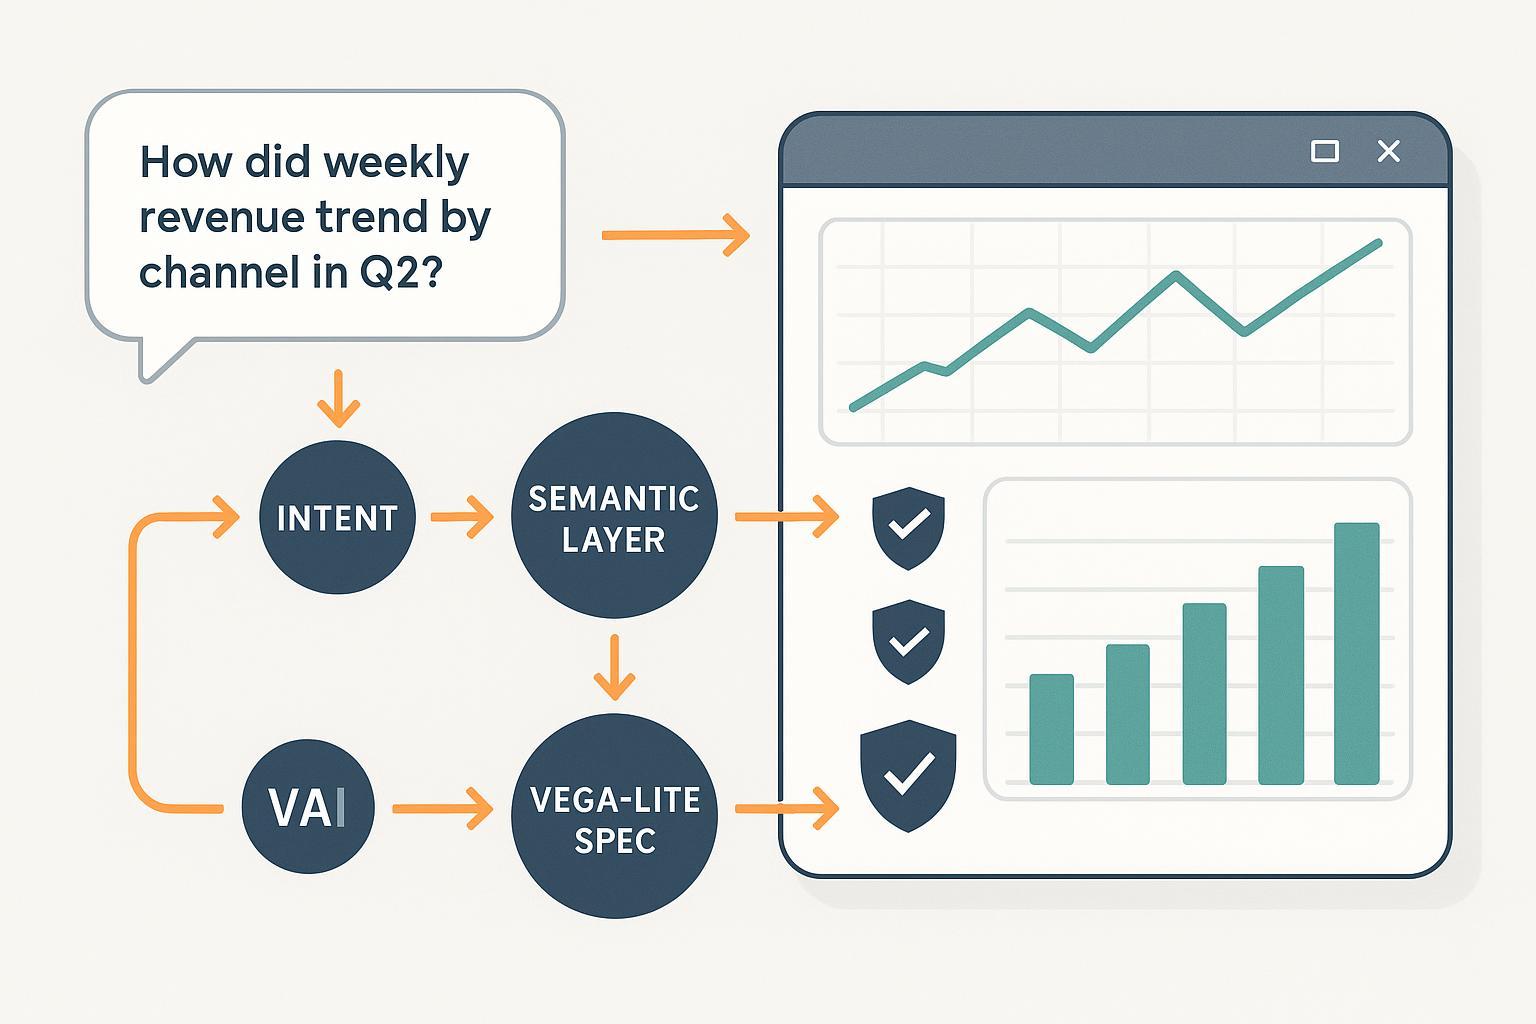
- What you’ll build: An NL→intent→semantic mapping→Vega-Lite spec→validation→render loop with human-in-the-loop review
- Why this works: Vega-Lite’s structured JSON and schema validation make it ideal for safe programmatic chart generation, while a semantic layer constrains the model to governed fields and metrics. Research shows stepwise reasoning plus validation improves LLM-to-chart quality, as demonstrated by the 2024 ChartGPT paper in IEEE VIS/ArXiv, which found iterative planning and checks boost ranking and first-choice accuracy compared to baselines (ChartGPT 2024, ArXiv/IEEE VIS).
What you need before you start
- A defined dataset with governed metrics and dimensions (e.g., sales, margin, channel, date, region)
- A semantic layer or modeling approach (dbt Semantic Layer/MetricFlow, Cube, LookML, or Power BI semantic model)
- A place to render Vega-Lite (web app using vega-embed, or a BI tool path if you choose a managed route)
- Basic familiarity with Vega-Lite encodings, marks, and selections. The official docs are concise and authoritative: see the encoding and channels overview in the Vega-Lite manual (Vega-Lite Encoding reference) and supported marks (Vega-Lite Marks).
Time boxes (realistic):
- Scoping and dictionary: 2–4 hours
- Semantic layer prep: 0.5–2 days
- Spec library and validation harness: 0.5–1 day
- NL→spec prompts and tool calls: 0.5–1 day
- Rendering + dashboard shell: 0.5 day
- Governance hardening: 1–3 weeks (parallelizable)
Step 1 — Scope the question space and data
Do this before you touch prompts. List the top questions users ask, the KPIs involved, and the required dimensions.
- Collect canonical names and synonyms (e.g., “revenue” ≈ “GMV” if that’s truly your policy). Include time grains (day/week/month) and units.
- Map each question to fields in your dataset. Capture owners and freshness SLAs.
Verify
- Every KPI has a definition, unit, default aggregation, and default time grain.
- Every field exists in the model with a clear type (quantitative, nominal, temporal, ordinal) as used by Vega-Lite’s type system (Vega-Lite field types).
If it fails
- Missing fields or ambiguous metrics? Create/align definitions in your model and add synonyms to your dictionary before moving on.
Step 2 — Build or align your semantic layer
Constrain the model by exposing only governed metrics/dimensions through a semantic layer or well-modeled dataset.
Common options (pick one):
- dbt Semantic Layer with MetricFlow: Define metrics and time grains, and expose via API/CLI. The dbt docs outline how to register metrics and query with MetricFlow commands and FAQs (2024 updates) (dbt Semantic Layer FAQs, MetricFlow commands).
- Cube: Model measures/dimensions and expose via REST/GraphQL Semantic API for downstream apps (Cube schema modeling).
- Looker: Model with LookML (dimensions/measures) and leverage governed Explore layers (Looker Write LookML intro).
- Power BI: Use a robust semantic model; Copilot relies on well-formed models and linguistic schemas for synonyms (Power BI Copilot: introduction and requirements).
Deliverable
- A JSON or YAML “dictionary” exposing: canonical metric names, accepted synonyms, field types, allowed aggregations, time grains, units, and example queries.
Verify
- CI checks ensure metric/field presence and types; reject PRs that alter definitions without review.
If it fails
- Add types and descriptions to your model. Keep the dictionary slim—retrieve only relevant snippets at inference time to reduce token bloat and confusion.
Step 3 — Assemble a tested Vega-Lite spec starter library
Create known-good patterns your NL system can adapt. Start with bar, line, area, scatter, heatmap, and simple faceting. Keep versions pinned to the current schema.
Examples (copy-paste and adapt):
- Minimal bar chart
{
  "$schema": "https://vega.github.io/schema/vega-lite/v5.17.0.json",
  "data": {"values": [{"a": "A", "b": 28}, {"a": "B", "b": 55}]},
  "mark": "bar",
  "encoding": {
    "x": {"field": "a", "type": "ordinal"},
    "y": {"field": "b", "type": "quantitative"}
  }
}
- Minimal line chart
{
  "$schema": "https://vega.github.io/schema/vega-lite/v5.17.0.json",
  "data": {"values": [{"t": 1, "v": 28}, {"t": 2, "v": 55}]},
  "mark": "line",
  "encoding": {
    "x": {"field": "t", "type": "quantitative"},
    "y": {"field": "v", "type": "quantitative"}
  }
}
- Interval selection (zoom/pan)
{
  "$schema": "https://vega.github.io/schema/vega-lite/v5.17.0.json",
  "data": {"url": "data/cars.json"},
  "mark": "point",
  "encoding": {
    "x": {"field": "Horsepower", "type": "quantitative"},
    "y": {"field": "Miles_per_Gallon", "type": "quantitative"}
  },
  "selection": {"brush": {"type": "interval", "bind": "scales"}}
}
Reference the official encoding channels and selections when expanding your library (Vega-Lite Encoding, Selections).
Verify
- Compile each spec with the Vega-Lite compiler and render with vega-embed during CI to ensure no regressions. The JSON schema for the current version is public and suitable for validators (Vega-Lite JSON Schema v5.x).
If it fails
- Check field types and mark-channel compatibility; consult the mark documentation for supported combinations (Vega-Lite Marks).
Step 4 — Design the NL→spec reasoning flow
Break the task into tool-callable steps. Don’t prompt a model for the final chart in one shot.
Flow
- Parse intent and extract metrics, dimensions, filters, time grain.
- Resolve entities against the semantic dictionary (exact and synonym matches only; no free-form field creation).
- Choose chart type with simple rules: trends → line/area; category comparison → bar; correlation → scatter; distribution → histogram/box; proportions → stacked bar (cap categories to avoid pie abuse).
- Set encodings (x, y, color, facet) with types and aggregations.
- Propose filters (date ranges, top-N caps). Default to governed grains.
- Synthesize Vega-Lite JSON; keep it minimal and valid.
Few-shot exemplar prompt snippet
You are a chart planner. Given (a) a governed dictionary of metrics/dimensions and (b) a user question, produce a minimal Vega-Lite v5 JSON.
Steps:
1) Identify metric(s) and aggregation policy.
2) Identify dimension(s) and time grain.
3) Choose chart type from {line, bar, area, scatter, heatmap}.
4) Emit JSON with only fields from the dictionary. No comments. Use types {quantitative, nominal, temporal, ordinal}.
Return only JSON.
Pseudo-code with schema lookup
question = "How did weekly revenue trend by channel in Q2?"
kb = retrieve_dictionary_snippet(["revenue", "channel", "date"])  # governed fields only
plan = llm_plan(question, kb)
fields = resolve_fields(plan, kb)
chart = choose_chart(plan, fields)
spec = synthesize_vegalite(plan, fields, chart)
Verify
- Dry-run a 20–50 question test set; log spec validity rate and reasons for failure.
If it fails
- Add clarifying question prompts when confidence is low or when multiple metrics match. Use retrieval that returns only the smallest necessary dictionary slice to fit model context and reduce confusion.
Step 5 — Validate and add guardrails
Use multiple layers of checks before rendering.
- JSON Schema validation
- Node/TypeScript (ajv)
import Ajv from "ajv";
import addFormats from "ajv-formats";
import schema from "https://vega.github.io/schema/vega-lite/v5.17.0.json";

const ajv = new Ajv({allErrors: true, strict: false});
addFormats(ajv);
const validate = ajv.compile(schema);
const valid = validate(spec);
if (!valid) throw new Error(JSON.stringify(validate.errors));
- Python (jsonschema)
import json, requests
from jsonschema import validate, Draft202012Validator

schema = requests.get("https://vega.github.io/schema/vega-lite/v5.17.0.json").json()
Draft202012Validator.check_schema(schema)
Draft202012Validator(schema).validate(spec)
The official schema is versioned and hosted by the Vega team, making it suitable for automated checks (Vega-Lite JSON Schema).
- Compile-before-render
import * as vegaLite from "vega-lite";
try {
  const compiled = vegaLite.compile(spec).spec; // Throws on invalid constructs
} catch (e) {
  // capture and log compile errors
}
The vega-lite package exposes a compile API used by the toolchain; wrap it in try/catch and log outcomes (see the vega-lite repo/releases for API usage patterns, 2024–2025) (vega-lite GitHub releases).
- Field/type whitelist and aggregation rules
- Enforce that every field in the spec exists in the semantic dictionary with a compatible Vega-Lite type.
- Apply safe defaults: SUM/AVG per metric policy; cap categories (e.g., top 10) to prevent illegible charts.
- Fallbacks
- If validation fails, show a tabular preview with the same filters.
- If intent is ambiguous, ask a targeted clarifying question (e.g., “By week or month?”).
Verify
- Add automated tests that feed known-bad specs and assert correct rejection reason categories (schema error, unknown field, type mismatch, compile error).
If it fails
- Log and bucket failures; use the top 3 categories as prompt engineering and dictionary improvement sprints.
Step 6 — Render and compose dashboards
Use vega-embed to render charts in a web app and assemble multi-visual answers.
- Basic embed pattern
<div id="vis"></div>
<script type="module">
  import embed from "https://cdn.jsdelivr.net/npm/vega-embed@6";
  const spec = /* your validated Vega-Lite JSON */;
  embed("#vis", spec, {actions: {export: true, source: true, editor: true}})
    .then(view => {/* attach events */})
    .catch(err => {/* show graceful error */});
</script>
See typical usage and options in the project documentation and examples (vega-embed on GitHub).
- Compose multi-visual answers: For “trend + breakdown,” render a line chart and a small bar chart side by side; link selections if useful.
- Accessibility: Provide descriptive titles/captions, use colorblind-safe schemes (e.g., perceptually uniform), and add ARIA labels on containers. The Vega docs summarize accessibility guidance and color scheme recommendations (Vega accessibility guidance, Vega-Lite color schemes).
Verify
- Hit latency SLOs (e.g., <2s P95 render after validation). Test keyboard navigation and tooltip readability.
If it fails
- Pre-aggregate at the semantic layer; reduce category counts; switch heavy visuals to server-side images for mobile.
Step 7 — Add human-in-the-loop editing
- Provide an “Edit spec” panel that shows the generated Vega-Lite JSON with linting; changes must re-run validation.
- Allow prompt edits and capture both original and corrected versions to an “active learning” dataset.
- Track correction types (field rename, chart type change, encoding tweak) and prioritize fixes that reduce repeated errors.
Verify
- Spec validity rate improves over time; repeated error types trend down across releases.
If it fails
- Add inline hints near invalid fields and surface compile error messages verbatim for faster fixes.
Step 8 — Governance, privacy, and security
- RBAC: Enforce permissions in the warehouse/semantic layer and in your app (dataset-, row-, or column-level as needed). Managed BI features inherit platform RBAC (e.g., Amazon QuickSight/Power BI/Tableau/Looker) and can be leveraged if you choose that route; Amazon Q in QuickSight kept RBAC and entitlements while adding generative BI in its 2024 GA (Amazon Q in QuickSight GA, 2024).
- PII handling: Mask/tokenize before inference; redact PII from prompts and logs.
- Data residency: Prefer region-pinned LLM endpoints or vendor features that respect residency (e.g., Tableau Pulse notes geo-aware LLM connectivity in product updates; confirm in your tenant’s docs) (Tableau new features page, 2025).
- Audit logs: Store prompts, dictionary snippets, generated specs, validation outcomes, human approvals, and render events.
- Rate limits and costs: Throttle per user, cache popular queries/specs, and enforce token caps.
Verify
- Quarterly access reviews; prompt red-teaming; checklists for SOC/ISO alignment and data protection impact assessments.
If it fails
- Add automated alerts for unusual prompt volumes or repeated validation bypass attempts; temporarily disable NL for affected datasets.
Step 9 — Measure and maintain
Define KPIs for your NL system:
- Spec validity rate (first-pass and post-edit)
- Answer helpfulness (thumbs up/down with comments)
- Time-to-insight (question to rendered chart)
- Adoption (weekly active askers)
Maintenance loop
- Refresh your 20–50 question test set monthly.
- Update the spec library with new proven patterns.
- Retire prompts that cause repeated confusion; prefer tool-augmented plans grounded in schema retrieval.
- Periodically review color/accessibility and performance regressions.
Example: From question to validated Vega-Lite
Scenario: “How did weekly revenue trend by channel in Q2?”
- Intent parsing
- Metric: revenue (aggregation: SUM)
- Dimensions: week (temporal), channel (nominal)
- Filter: Q2 of the current year
- Chart: line with color by channel
- Minimal spec
{
  "$schema": "https://vega.github.io/schema/vega-lite/v5.17.0.json",
  "data": {"name": "table"},
  "mark": "line",
  "encoding": {
    "x": {"field": "week", "type": "temporal", "timeUnit": "yearweek"},
    "y": {"aggregate": "sum", "field": "revenue", "type": "quantitative"},
    "color": {"field": "channel", "type": "nominal"},
    "tooltip": [
      {"field": "week", "type": "temporal"},
      {"field": "revenue", "type": "quantitative"},
      {"field": "channel", "type": "nominal"}
    ]
  },
  "transform": [
    {"filter": {"field": "date", "timeUnit": "quarter", "equal": 2}},
    {"filter": {"field": "date", "timeUnit": "year", "equal": 2025}}
  ]
}
- Validate
- JSON Schema: pass
- Compile-before-render: pass
- Field whitelist: “revenue,” “channel,” “date,” “week” exist and types match dictated policy
- Render
- Use vega-embed to render the chart; ensure color scheme is colorblind-safe and provide a descriptive title. Vega-Lite tooltips are configured via the tooltip channel (Vega-Lite tooltip reference).
Note: If your warehouse lacks a “week” field, compute it in the semantic layer or replace timeUnit with “yearmonth” for monthly trends.
Toolbox: Build vs buy (neutral options)
These options can accelerate or host parts of the NL→chart experience. Choose based on deployment model, governance needs, and team skill sets.
- Microsoft Power BI Copilot: Generates report pages from natural language and answers data questions within the Copilot pane; requires Fabric capacity and well-modeled semantic models (Microsoft Learn, 2024–2025) (Copilot overview and requirements).
- Tableau Pulse: Delivers NL summaries and enhanced Q&A over governed metrics; integrates with dbt metrics and Tableau Cloud governance (Tableau docs and feature pages, 2024–2025) (Pulse overview and updates).
- Amazon Q in QuickSight: Generative BI with NL Q&A and data stories; GA in 2024 with role-based governance and entitlements preserved (AWS BI blog, 2024) (Amazon Q in QuickSight GA).
- Looker with Gemini: Conversational analytics, Visualization Assistant, and governed Explore modeling (Google Cloud, 2024–2025) (Gemini in Looker overview).
- WarpDriven: AI-first ERP/analytics platform that can participate in NL analytics workflows in eCommerce and supply chain contexts. Disclosure: WarpDriven is our product.
Selection criteria
- Deployment: SaaS vs hybrid; data residency controls
- Governance: Metric layer maturity, RBAC, auditability
- Interop: Ability to export or embed chart specs or visuals
- Learning curve: Admin/modeling overhead, user training needs
Minimal project structure (suggested)
nl2charts/
  prompts/
    few_shots.md
  dictionary/
    metrics.yaml
    dimensions.yaml
  specs/
    bar.json
    line.json
    scatter.json
  src/
    plan.ts
    validate.ts
    compile.ts
    render.ts
  tests/
    questions.csv
    invalid_specs.test.ts
  web/
    index.html
    app.js
Troubleshooting checklist (quick reference)
- Ambiguous metric or grain → Ask: “Which time grain (week, month)?” Default to governed grain.
- Wrong chart type → Apply mapping rules; prefer bar/line; cap slices for proportions.
- Invalid JSON/spec → Run JSON Schema validation first; strip comments; ensure field types match.
- Compile errors → Capture vega-lite compile error; fix encoding/transform order; retry.
- Unknown field/type → Enforce whitelist; update dictionary or correct synonym mapping.
- Too many categories → Apply top-N cap in transform; suggest filter.
- Latency or context overflows → Retrieve only relevant dictionary slices; cache frequent Q→spec pairs.
- Accessibility flags → Switch to colorblind-safe schemes; add ARIA labels and descriptive titles (see Vega accessibility guidance).
Keep learning and ship confidently
- Vega-Lite fundamentals: encoding/channels and marks are well-documented and stable for 2025 (Encoding reference, Marks).
- vega-embed patterns enable robust embedding with export and editor actions (vega-embed project).
- For NL quality, use stepwise planning and validation, which research shows improves outcomes over one-shot generation (ChartGPT 2024).
Pilot with 10–20 curated questions, measure spec validity and helpfulness weekly, and iterate on your dictionary and spec library until failures become rare. Then, expand coverage to new domains and questions with confidence.