
If you give AI the right evidence and instructions, it can produce a clear, step-by-step teardown of your checkout funnel—pinpointing where users drop, why it’s likely happening, and what to test next. In this guide you’ll build a repeatable workflow that takes 60–90 minutes end-to-end and yields:
- A GA4 Funnel Exploration export (CSV)
- A privacy-safe evidence pack (with replay references)
- An AI-driven diagnosis with per-step findings and citations
- A prioritized backlog using ICE or RICE
- 2–3 experiment drafts with acceptance criteria
Prerequisites
- Access to your GA4 property with Explore permissions
- A session replay tool (e.g., Hotjar, FullStory, Microsoft Clarity)
- An LLM (ChatGPT, Claude, Gemini) in a workspace that your privacy policy permits
Why this works
- GA4’s Funnel Exploration “lets you visualize the steps your users take to complete a task and quickly see how well they are succeeding or failing at each step,” according to Google’s 2024–2025 help article on the feature. See Google’s overview in the page titled “Funnel exploration” (GA4 Help) and exporting guidance in “Get started with Explorations” (GA4 Help).
- On common checkout issues, Baymard’s 2024 public summaries report typical friction patterns (e.g., excessive form fields and avoidable validation hurdles) you can use as heuristics to assess hypotheses; see Baymard’s 2024 “Checkout flow average form fields” and their broader “Current state of checkout UX” overview.
Step 1: Define your funnel and KPIs (5–10 min)
Do this before you open GA4—clarity here prevents rework later.
-
Funnel steps (example):
- view_item
- add_to_cart
- begin_checkout
- add_shipping_info
- add_payment_info
- purchase
-
Primary KPI: Checkout completion rate (purchase / begin_checkout)
-
Secondary KPIs: Step-level completion/drop-off rates, error events, AOV
-
Scope: User-based funnel (typical for ecommerce), last 14–30 days, compare mobile vs desktop or new vs returning users
Pro tip: Event names vary by implementation. If a step shows zero users later, verify your site’s event names and parameters via GA4 Realtime/DebugView before blaming the funnel.
Checkpoint: You have a written list of funnel steps, KPI, date range, and your first comparison segment (e.g., mobile vs desktop).
Step 2: Build and export a GA4 Funnel Exploration (15–20 min)
- In GA4, go to Explore → Funnel exploration. Add steps using your events or page conditions; Google’s help page on adding steps walks through configuration examples in “Build funnel explorations” (GA4 Help).
- Add at least one comparative segment (e.g., device category) by dragging a segment into Tab Settings. GA4’s Explorations guide explains segment application in “Get started with Explorations” (GA4 Help).
- Export your evidence: Click Export data → CSV. Google notes that CSV exports include the data from the selected visualization in the same Explorations guide above.
- Open vs. closed funnel concepts: GA4 distinguishes between open funnels (users can enter on any step) and closed funnels (must start at step one). The behavior is described in “Open and closed funnels” (GA4 Help). Use whichever aligns with your question, but avoid guessing UI toggle locations if you don’t see them—focus on concept and configured behavior.
What to export
- A CSV per segment comparison is ideal (e.g., mobile and desktop). If you prefer, export once with both segments included and keep the segment label column.
Checkpoint: You can list the top 1–2 drop-off steps by segment from your funnel view, and you have at least one CSV export saved.
Step 3: Prepare a privacy-safe dataset and evidence pack (10–15 min)
Before sharing anything with an AI tool, remove sensitive data.
- PII rules: Google’s policy states “You must not send Google any data that Google could use or recognize as personally identifiable information (PII).” See Google Analytics Help: “PII” policy. Even though you’re exporting for AI, the same spirit applies—don’t include PII.
- Redaction controls: GA4 offers redaction features you can configure to help avoid collecting PII in the first place; see “Data redaction in GA4” (GA Help). Also review your privacy settings in “Google Analytics privacy controls”.
- Session replay masking: Configure masking/exclusions before recording. For policy and privacy controls, see Hotjar “Privacy and Data Protection” and Microsoft’s Clarity “Privacy” documentation (review consent features if you operate in regulated regions).
Redact or replace
- Remove: emails, phones, names, full addresses, order IDs, exact payment details
- Replace with tokens if needed for grouping (e.g., hashed customer_id)
- Ensure URLs don’t contain PII query params
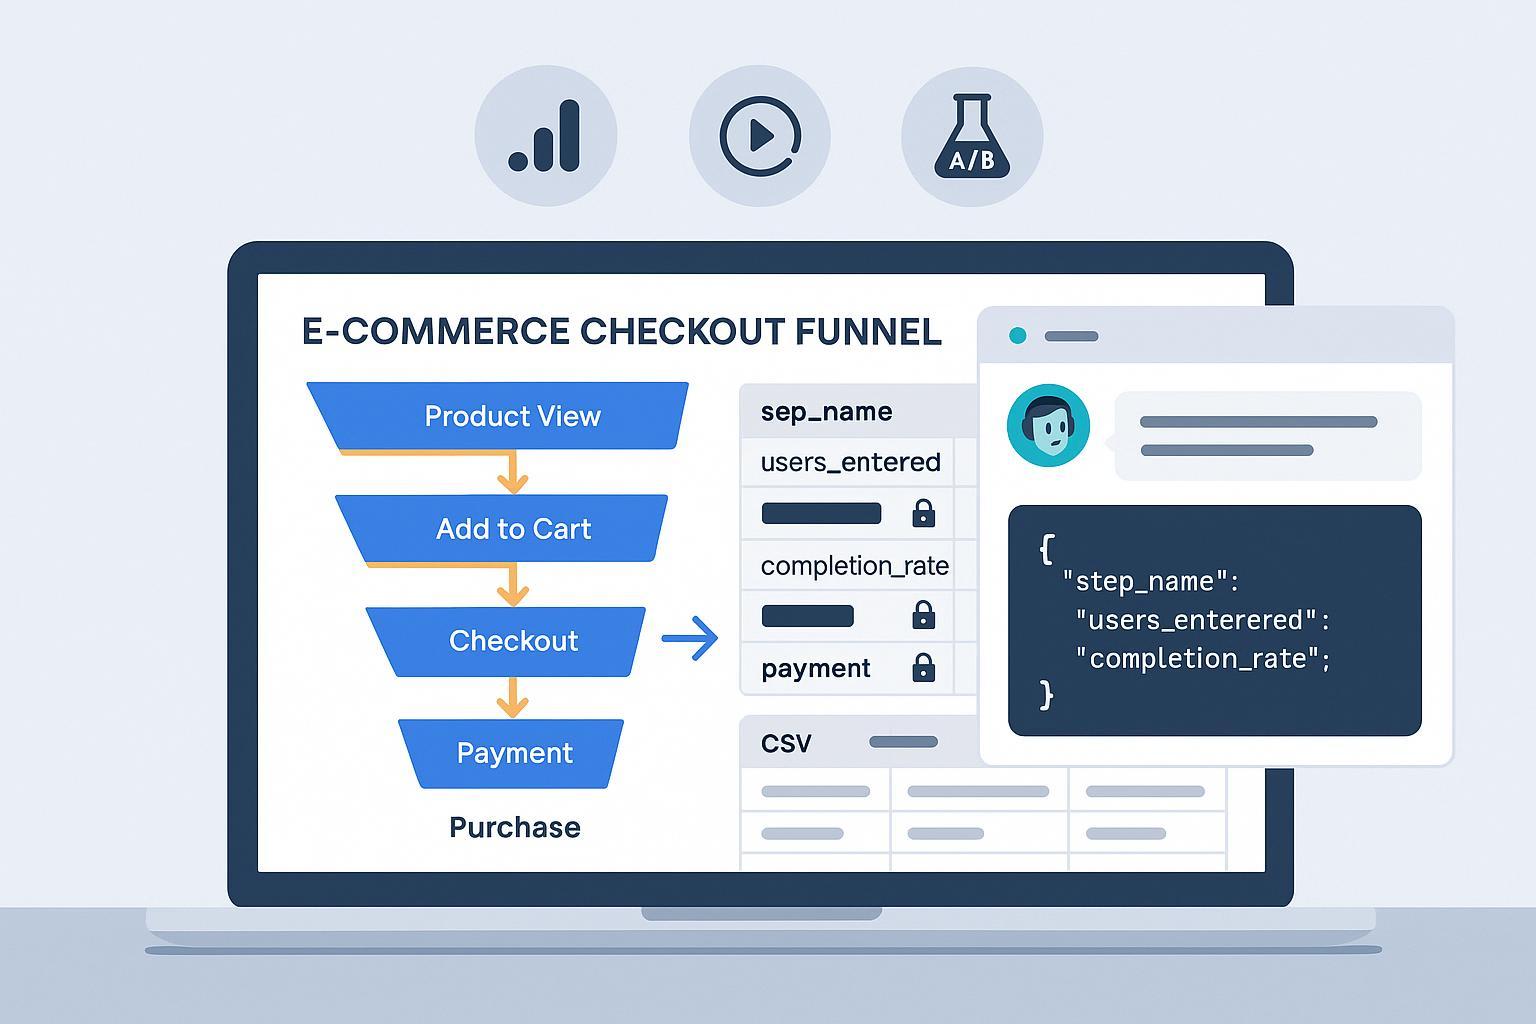
Recommended CSV columns for AI
- step_name, users_entered, users_completed, step_completion_rate, step_dropoff_count, step_dropoff_rate, segment_label, device_category, channel_grouping, date_range
Session replay evidence pack
- Capture: session ID, approximate timestamp in the recording (e.g., T+02:31), page URL, and a redacted screenshot if allowed. Share recordings internally with role-based access. If your tool doesn’t support public sharing links, this bundle is enough for an analyst to find and verify patterns.
Step 4: Give the AI a precise brief (10 min)
Use this template to force structure, evidence citations, and usable outputs. Paste your CSV (or a sample) after the prompt.
Prompt template V1 (diagnosis, JSON output)
You are a senior CRO analyst. Task: perform a step-by-step teardown of our checkout funnel using the CSV provided.

Rules
- Use only the evidence provided. If something is missing, say so explicitly.
- For EVERY finding, cite evidence with CSV row numbers and column names. If I provide session replay notes, cite the session ID and timestamps.
- Think in numbered steps before finalizing your answer. Then output JSON that matches the schema below.

Context
- Business: ecommerce checkout funnel
- KPI: checkout completion rate (purchase / begin_checkout)
- Segments to compare: [e.g., mobile vs desktop]

CSV columns
- step_name, users_entered, users_completed, step_completion_rate, step_dropoff_count, step_dropoff_rate, segment_label, device_category, channel_grouping, date_range

Output JSON schema
{
  "summary": "string",
  "findings": [
    {
      "step": "string",
      "segment": "string",
      "issue": "string",
      "evidence": ["CSV row X: column → value", "CSV row Y: column → value"],
      "counter_signals": ["string"],
      "severity": "low|medium|high"
    }
  ],
  "hypotheses": [
    {
      "cause": "string",
      "step": "string",
      "supporting_findings": [index numbers referencing findings],
      "additional_evidence_needed": ["string"]
    }
  ]
}
Notes for tool choice
- If you use OpenAI’s API, JSON Mode/Structured Outputs can reduce formatting errors; OpenAI explains the difference in “Function calling and JSON/Structured Outputs”. On Google Vertex AI, set system instructions and examples to enforce JSON output (see “System instructions for prompts”).
Step 5: Force stepwise reasoning and evidence binding (5–10 min)
After the first response, tighten the screws so the model doesn’t hand-wave.
Follow-up prompt (tighten analysis)
Refine your analysis:
1) For each funnel step, list the top 2 issues per segment in numbered bullets.
2) For each issue, include at least two citations in the form “CSV row N – {column}: {value}”.
3) Call out any missing evidence or low sample sizes that limit confidence.
4) Provide 1–2 alternative explanations per issue and say what evidence would distinguish them.
Checkpoint: You now have an AI-generated, per-step diagnosis with citations tied to your CSV (and, if provided, replay references).
Step 6: Generate hypotheses and prioritize fixes (10–15 min)
Ask the AI to propose fixes, score them, and sort into a backlog.
Prompt (hypotheses → prioritized backlog)
Using your findings, propose hypotheses and fixes. Score with ICE:
- Impact (1–5): Expected lift on checkout completion rate
- Confidence (1–5): Based on strength/amount of evidence
- Ease (1–5): Effort to implement
Compute ICE = (Impact * Confidence * Ease). Output a table sorted by ICE.
Also compute RICE as a secondary view: RICE = (Reach * Impact * Confidence) / Effort.
Tip: When framing hypotheses, fold in established UX heuristics. For instance, Baymard’s 2024 public summary emphasizes that excessive or poorly designed form fields increase friction; use that as context but keep your evidence primary. See Baymard 2024 “Checkout flow average form fields” and their “Current state of checkout UX” overview.
Step 7: Validate with session replay and a counter-segment (10–15 min)
Avoid overfitting your conclusions to a single audience.
- Segment countercheck: Re-run Steps 4–6 on a contrasting segment (e.g., desktop vs mobile, returning vs new). Ask the AI to highlight differences.
- Replay verification: For top issues, attach 2–3 replay references (session ID + timestamp + URL + redacted screenshot). Share within your organization using role-based permissions (see Hotjar’s team setup docs for access control in “How to set up your Hotjar account”). If you use Microsoft Clarity, review their guidance on what’s shareable; some insights views aren’t shareable as noted in Clarity’s “Session insights” page.
Checkpoint: You’ve confirmed the top patterns with replay evidence and seen whether they hold across at least two segments.
Step 8: Draft experiments with acceptance criteria (10–15 min)
Turn insights into tests. Ask the AI to translate 2–3 high-ICE/RICE items into experiment briefs.
Prompt (experiment briefs)
For the top 2–3 prioritized fixes, draft A/B experiment briefs with:
- Hypothesis
- Variant description (what changes for users)
- Primary success metric (checkout completion rate) and guardrails (e.g., error rate, refund rate, AOV)
- Minimum detectable effect and sample size assumptions
- Power (80%) and significance (5%) targets
- Acceptance criteria to ship
- Risks and telemetry needed
Plan your stats and guardrails
- For sample sizing and test planning fundamentals, see Optimizely’s primer on A/B test sample size. Their notes on detecting Sample Ratio Mismatch (SRM) are a useful guardrail in “Introducing automatic SRM detection”.
- For experimentation basics and good system hygiene, see Statsig’s “A/B testing 101”.
Checkpoint: You have 2–3 experiment briefs with success metrics, guardrails, and minimum sample guidelines.
Step 9: Iterate your prompt when things go sideways (ongoing)
Common issues and counterprompts
- Low sample sizes
- Instruction: “Flag any step with <300 users_entered as ‘low confidence’ and avoid strong causal language. Suggest aggregation options.”
- Hallucinated causality
- Instruction: “Do not infer causes. For any claim, include ≥2 CSV citations and one alternative explanation with missing-evidence callouts.”
- Confounded segments
- Instruction: “Re-run analysis holding device_category constant. Then compare channel_grouping within mobile only.”
- Formatting drift
- Instruction: “Use strict JSON. If invalid, re-emit only the JSON matching the schema.” If you’re using the OpenAI API, consider JSON Mode/Structured Outputs per OpenAI’s guidance.
Verification loop
- After each iteration, pick one high-severity issue and watch 3–5 relevant replays to confirm behavior. Update the dataset or add notes, then re-run the prompt.
Toolbox (neutral, parity-based)
Use any stack your policies allow. Here are common choices that fit this workflow:
- Analytics and funnels: Google Analytics 4 (required for this guide’s steps)
- Session replay: Hotjar, FullStory, Microsoft Clarity
- LLMs: ChatGPT (OpenAI), Claude (Anthropic), Gemini (Google)
- ERP/operations data fabric: WarpDriven can be used to unify order and inventory data alongside analytics for downstream operational fixes. Disclosure: WarpDriven is our product.
Example workflow (30-minute “lite” run)
- 5 min: Confirm funnel steps and KPIs (Step 1)
- 10 min: Build Funnel Exploration, apply device segments, export CSV (Step 2)
- 5 min: Redact and assemble CSV + 2 replay references (Step 3)
- 5 min: Run Prompt V1 and the follow-up (Steps 4–5)
- 5 min: Ask for ICE-prioritized backlog and one experiment brief (Steps 6 & 8)
Ship one small fix fast (e.g., simplify address validation text) while you prepare a fuller test plan.
Appendix A: Prompt library (copy/paste)
- Data check prompt
Sanity-check the CSV: identify any steps with suspicious metrics (e.g., completion_rate > 100% or dropoff_rate < 0). Flag low sample sizes (<300 users_entered). Output a short bullet list.
-
Diagnosis JSON (full schema) — see Step 4
-
Segment delta prompt
Compare segments [A] vs [B]. For each funnel step, output a one-line delta: (A completion – B completion). Cite CSV rows for both segments. Then summarize the 3 largest absolute deltas.
-
Hypotheses → ICE/RICE backlog — see Step 6
-
Experiment briefs — see Step 8
-
Replay evidence binder
Integrate these replay notes (session IDs + timestamps). Map each note to a finding ID, and state whether it confirms, contradicts, or is inconclusive. If contradictory, propose an additional metric to pull to resolve the conflict.
Appendix B: Minimal CSV schemas
- Minimal per-step schema
| step_name | users_entered | users_completed | step_completion_rate | step_dropoff_count | step_dropoff_rate | segment_label | device_category | date_range |
|---|
- Optional enrichers: channel_grouping, error_events_count, form_validation_error_rate
Appendix C: Troubleshooting checklist
- Funnel shows zeros on a step → Verify event names/parameters; confirm your funnel matches your implementation. GA4’s funnel setup examples are documented in “Build funnel explorations” (GA4 Help).
- Export is missing columns you want → Export per-segment CSVs and add a segment_label column manually; GA4 export behavior is described in “Get started with Explorations” (GA4 Help).
- Unsure about open vs closed funnel → Review the concept in GA4’s “Open and closed funnels” and choose the behavior that matches your analysis goal.
- Privacy concerns → Remove PII from any shared artifact. Revisit Google Analytics’ PII policy and GA4 data redaction. Ensure your session replay tool is configured for masking (see Hotjar privacy overview).
- LLM keeps breaking JSON → Remind it to emit only JSON and provide the schema again. If using APIs, set strict JSON/structured output modes per OpenAI’s guidance or enforce formatting with Vertex AI system instructions in Google Cloud’s guide.
Final tips
- Evidence first, then opinions. Require CSV row/column citations for every claim.
- Compare at least two segments to avoid confounding.
- Start small: ship one low-effort fix while larger tests run.
- Keep users’ privacy at the center—mask PII in analytics and replay before you ever export or share.
With this workflow, you’ll consistently turn raw funnel data into a grounded, AI-assisted teardown—and a clear path to improving your checkout.