
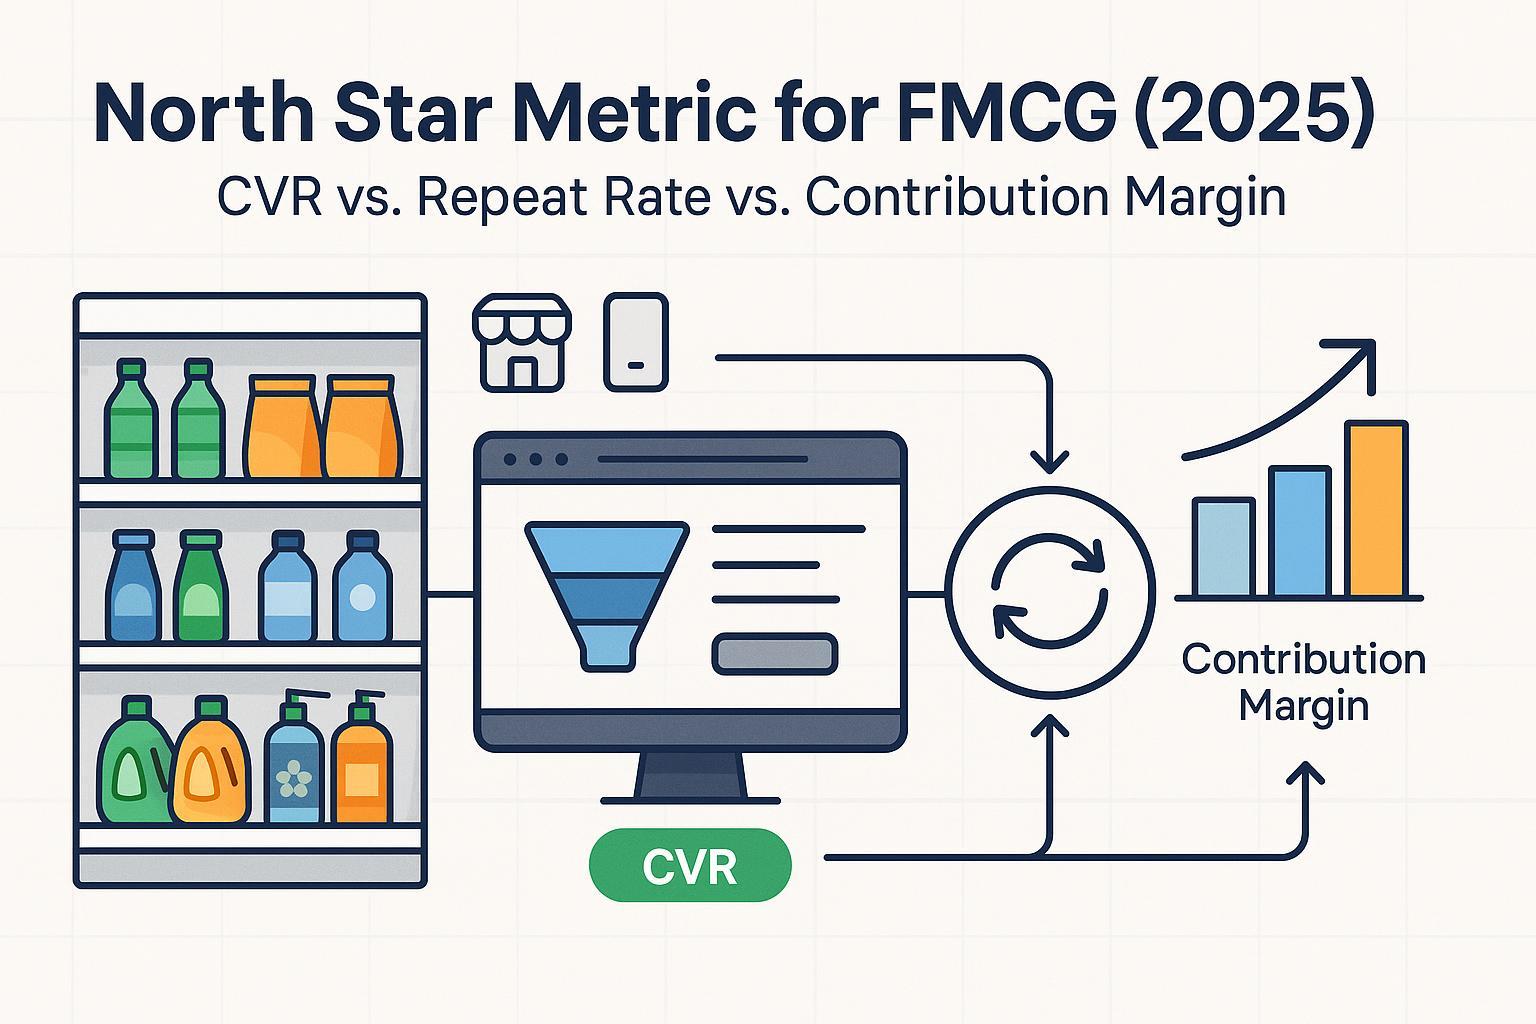
Picking a single North Star metric (NSM) for an FMCG/CPG brand is hard because growth lives at the intersection of three realities: demand creation (reach and trial), habit formation (replenishment), and unit economics (profitability). In 2025, the three most common contenders are Conversion Rate (CVR), Repeat Purchase Rate, and Contribution Margin. Each can be the right choice—depending on your stage, channels, and constraints.
This guide cuts through the noise with scenario-based recommendations, guardrails to avoid metric gaming, and cross-channel measurement tips.
The quick take: how they differ
| Metric | What it really optimizes | Leading vs. lagging | Cross-channel measurability | Susceptible to gaming | Best when… | Critical guardrails |
|---|---|---|---|---|---|---|
| Conversion Rate (CVR) | Funnel efficiency and offer/UX effectiveness | Leading for DTC; very sensitive to traffic mix and promos | DTC/app strong; not directly comparable to retail sell-through | High (discounts, retargeting existing buyers) | Early-stage DTC or launch sprints focused on new-buyer acquisition | AOV, CM%, new-buyer share, returns, LTV:CAC |
| Repeat Purchase Rate | Habit formation and retention | Slower-moving; can lag demand creation | DTC easy; retail requires panels/loyalty data | Medium (subscriptions/loyalty mechanics can mask churn) | Scaling brands with stable distribution seeking durable growth | New-buyer %, buyer penetration, distribution/ACV, price realization |
| Contribution Margin (CM$ / CM%) | Profitable growth and portfolio/pricing discipline | Lagging; excellent for resource allocation | Strong across channels (if costs are mapped consistently) | Medium (cost exclusions/allocations can bias) | Capital-constrained, retail-led, multi-SKU situations | Penetration and new-buyer %, distribution/ACV/TDP, media reach/SOV, promo ROI |
Notes: CM layering often follows CM1 (post-COGS), CM2 (post-trade), CM3 (post-logistics)—terminology varies by company.
How to choose in practice (2025 decision tree)
- If most revenue is DTC and you’re in launch or aggressive acquisition mode → Make your NSM “New-buyer CVR (first-order CVR).”
- Guard it with CM%, AOV, LTV:CAC, paid share of new buyers, and returns.
- If you have stable distribution and want durable growth → Make your NSM “Repeat Purchase Rate” (time-bounded to the true consumption cycle).
- Guard it with new-buyer %, market penetration growth, and distribution/ACV.
- If you’re capital-constrained, retail-led, or managing a complex portfolio → Make your NSM “Contribution Margin Dollars (CM$)” at SKU/brand.
- Guard it with penetration/new-buyer %, distribution/ACV/TDP, price realization, and media reach.
No universal winner exists. The right NSM depends on your economics and channel reality—always paired with 3–5 guardrails to prevent tunnel vision.
CVR, Repeat Rate, CM—deep dives with 2025 context
Conversion Rate (CVR)
What it measures
- Percentage of visits that convert into orders (Orders ÷ Sessions × 100).
Where it shines
- Fast feedback loops for offer, UX, and channel mix; excellent for DTC acquisition sprints and product launches.
Benchmarks and context
- Across industries, recent data places consumer categories like Food & Beverage and Beauty near the top. For instance, Food & Beverage recorded 3.1% in Q4 2024 in the Statista global breakdown, while the overall average sat a little above 2% (Statista’s industry/device view). See the category ranking in the Statista Q4 2024 industry conversion rates.
- Aggregated ecommerce trackers also show higher conversion in FMCG categories; Oberlo’s 2024 rollup lists Food & Beverage at 6.11% and Beauty at 4.55% (methodology varies), supporting a working FMCG DTC range around 3–6%. See the Oberlo 2024 industry conversion rate overview.
- Device matters: smartphones dominate traffic and a majority of orders, but desktops still tend to convert better per the Statista 2024 device share charts.
Limitations and pitfalls
- Heavily influenced by traffic quality, discounts, and merchandising; not comparable to retail sell-through.
- Over-optimizing CVR can depress AOV or margin, or skew spend toward retargeting existing buyers.
Practical guardrails
- Report both gross CVR and “clean CVR” (excluding deep promos). Track AOV, CM%, returns, paid share of new buyers, and new-buyer CVR vs. overall CVR. Investor norms often cite LTV:CAC ≥ 3:1 as a health check—see a16z’s explanation of the LTV:CAC benchmark.
Example
- A beverage DTC site lifts CVR from 2.5% to 4.0% via UX and promo tweaks, but CM% drops 5 points. With guardrails, the team reduces promo depth; CVR stabilizes at 3.6% with margin restored and ≥70% of orders from new buyers.
Repeat Purchase Rate
What it measures
- Percentage of customers making 2+ purchases within a defined window. The window should reflect product consumption (e.g., 30/60/90 days for beverages; longer for beauty/household).
Where it shines
- A durable indicator of habit formation and product-market fit, especially when subscriptions or loyalty programs are in play.
Marketing science backdrop
- Decades of work associated with Ehrenberg-Bass finds brands usually grow more by increasing buyer penetration than by squeezing more buys from a static base (the “double jeopardy” pattern). See the WARC summaries referencing this research: WARC on three rules of brand growth and WARC on mental availability’s business impact (2024).
Benchmarks and context
- Public, category-specific FMCG repeat benchmarks are scarce. As a directional ecommerce marker (not FMCG-specific), many operators reference returning-customer/retention rates around the 20–40% band, with wide variance by model and category. See the context in Shopify’s 2025 retention overview. Use internal and panel data to set realistic targets.
Limitations and pitfalls
- If penetration and distribution stall, a rising repeat rate can mislead. Subscriptions and loyalty incentives can mask underlying churn or erode margin.
Practical guardrails
- Pair repeat as NSM with new-buyer %, market penetration growth, and distribution/ACV (weighted distribution) guardrails. NIQ’s TDLinx materials explain how ACV underpins potential reach—see NIQ’s TDLinx/distribution context.
Measurement notes
- Triangulate DTC cohorts with panels (NIQ, Circana) and retailer loyalty analytics. Report repeat incidence by window (e.g., 60/90/180 days) and SKU pack-size, not just an annual average.
Contribution Margin (CM and CM$)
What it measures
- Profit contribution after variable cost layers, often tracked as CM1 (post-COGS), CM2 (post-trade), CM3 (post-logistics/cost-to-serve). Companies label these differently—align with your finance team.
Where it shines
- Forces profitable growth discipline; enables pricing, promo/trade ROI, and portfolio allocation across channels. Revenue growth management (RGM) playbooks rely on it—see McKinsey’s perspective on RGM for sustainable growth in consumer goods in “Harnessing revenue growth management for sustainable success” and Bain’s broader outlook in the Consumer Products Report 2025.
Limitations and pitfalls
- CM is inherently lagging and sensitive to cost treatment. Optimizing CM alone can starve reach, innovation, and distribution during key growth windows.
Practical guardrails
- Track buyer penetration and new-buyer %, distribution (ACV/TDP), price realization/net revenue management, and media reach/share of voice alongside CM. Reconcile CM ladders monthly with Finance.
Example
- A snack portfolio prioritizes CM$ at the brand/SKU level to manage cash. Guardrails ensure year-over-year penetration and ACV increase; price-pack architecture changes are staged to protect repeat while lifting realized price.
Cross-channel measurement reality check
- DTC/app analytics are your fastest signals for CVR and first-order repeat, segmented by traffic source and device. Maintain a “clean CVR” view excluding deep promos.
- Retail and marketplace require complementary sources: use consumer panels (NIQ, Circana) for penetration and repeat incidence, and retailer loyalty portals for retailer-specific repeats and baskets.
- Amazon and other marketplaces: Amazon Brand Analytics includes a Repeat Purchase Behavior report for brands/ASINs—see the official Amazon Repeat Purchase Behavior documentation.
- Identity resolution is imperfect; triangulate rather than forcing false precision. Normalize for seasonality and pack-size.
Risks, pitfalls, and the guardrails that keep you honest
Goodhart’s Law warns: “When a measure becomes a target, it ceases to be a good measure.” See the entry on Goodhart’s Law.
| If you choose… | Common pitfalls | Guardrails to add |
|---|---|---|
| CVR | Discount-driven spikes; traffic mix gaming (retargeting existing buyers); lower AOV/CM | AOV, CM%, new-buyer CVR vs. overall CVR, paid share of new buyers, returns, LTV:CAC |
| Repeat Rate | Illusory health if penetration stalls; subscription mechanics masking churn; margin erosion via loyalty subsidies | New-buyer %, market penetration growth (panel), distribution/ACV, price realization |
| CM$ / CM% | Under-investment in reach/distribution; biased cost allocations; slow feedback | Penetration/new-buyer %, distribution/ACV/TDP, media reach/SOV, promo ROI |
Short, practical scenarios
- Early-stage DTC beverage launch: NSM = New-buyer CVR. Weekly report shows gross vs. clean CVR, AOV, CM%, paid new-buyer share, and returns. Decision: cap promo depth to keep CM% ≥ target while A/B testing bundles to sustain CVR.
- Scaling omnichannel beauty brand: NSM = 90-day Repeat Rate. Guardrails = new-buyer %, panel-measured penetration, and ACV. Decision: expand distribution in priority banners and maintain broad-reach media to protect penetration while optimizing replenishment.
- Capital-constrained, retail-led snacks: NSM = CM$ by SKU/brand. Guardrails = penetration/new-buyer %, ACV/TDP, and promo ROI. Decision: rationalize low-CM SKUs, reinvest savings in distribution and mental availability to avoid a demand dip.
Bottom line
- DTC-first or launch mode → favor New-buyer CVR (first-order CVR) with profitability and quality guardrails.
- Scale-up with stable distribution → favor time-bounded Repeat Rate with penetration and distribution guardrails.
- Capital-constrained, retail-led portfolio → favor CM$ with reach/penetration and pricing realization guardrails.
If forced to pick one cross-scenario anchor for retail-led FMCG, CM$ is the safest—provided you hard-wire penetration and distribution guardrails so you don’t starve the future.
Also consider: operational tooling
Platforms that centralize cross-channel data make it easier to monitor your chosen NSM and its guardrails in one place. WarpDriven is an AI-first ERP for ecommerce and supply chain that unifies commerce, supply, and finance data—useful for tracking CVR, Repeat, and CM across DTC and retail ecosystems. Disclosure: WarpDriven is our product.
Further reading cited in this guide
- Industry conversion context: Statista’s Q4 2024 industry conversion rates and Oberlo’s 2024 industry conversion rollup
- Device behavior: Statista’s 2024 device visit/order shares
- Retention context (broad ecommerce): Shopify’s 2025 retention overview
- Marketing science on penetration/availability: WARC’s “three rules of brand growth” summary and WARC on mental availability (2024)
- RGM and CM practice: McKinsey on RGM for sustainable success and Bain Consumer Products Report 2025
- Distribution/ACV in CPG: NIQ’s TDLinx/distribution context
- Marketplace repeat measurement: Amazon Repeat Purchase Behavior documentation
- Guardrails principle: a16z on LTV:CAC and Goodhart’s Law