
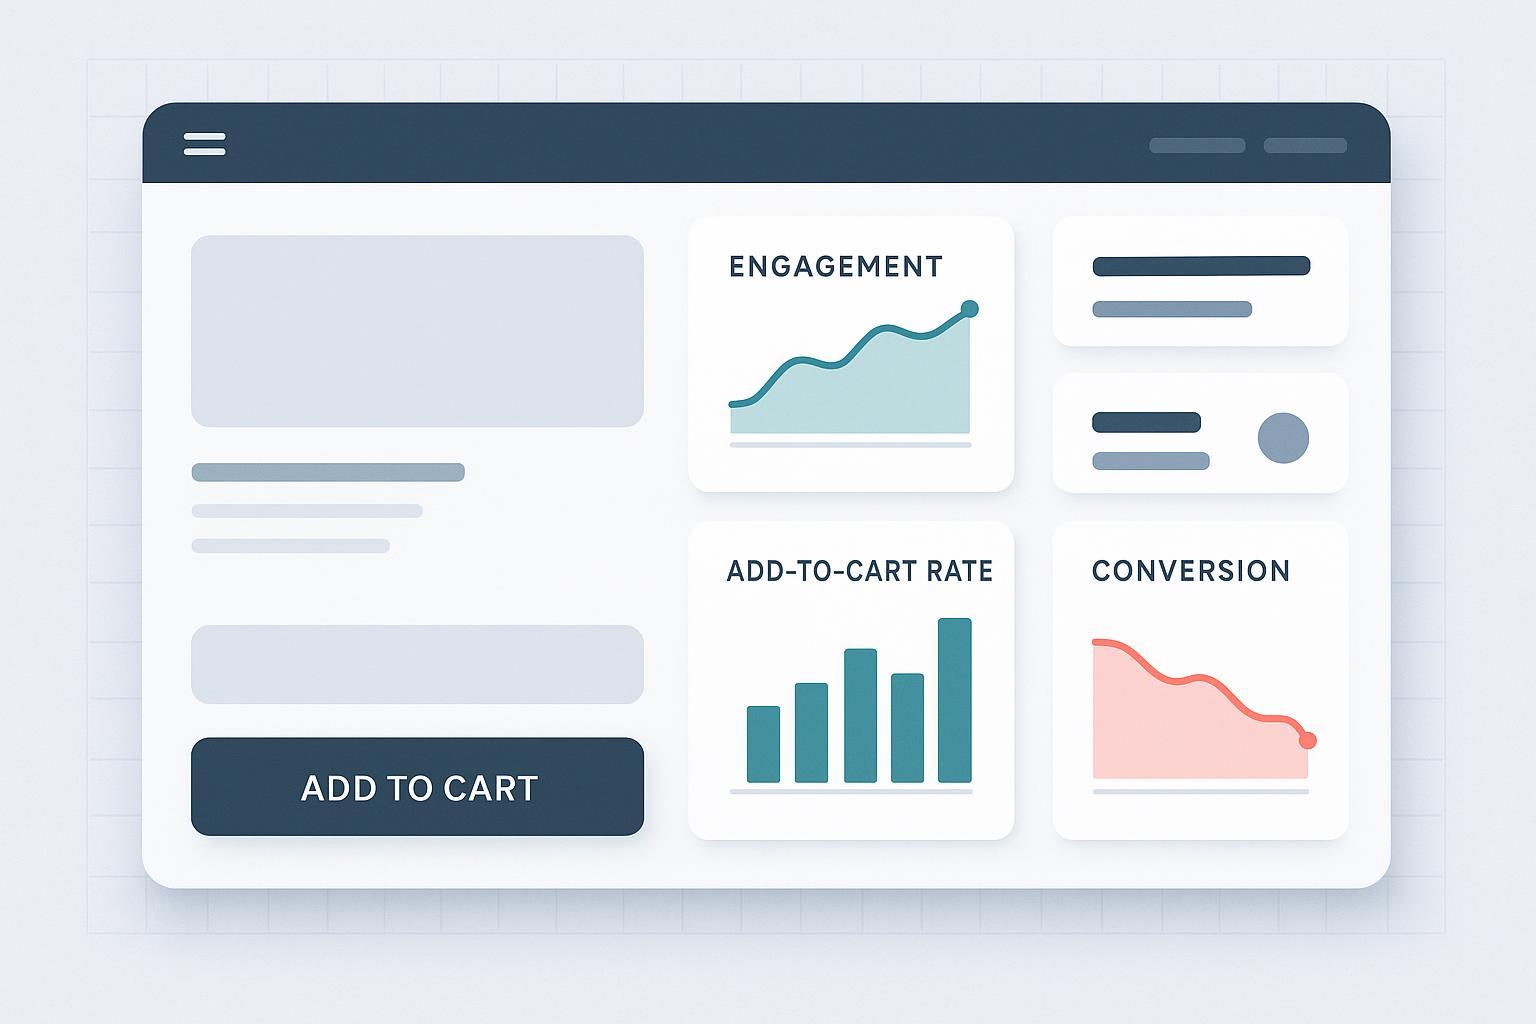
When product detail page metrics say one thing and revenue says another, something’s off. You see longer time on page, deeper scroll, more gallery interactions—yet add‑to‑cart and purchases slump. That paradox usually points to one of two things: your PDP content isn’t answering decision‑critical questions, or your traffic mix has shifted toward research behavior. This article shows you how to tell which is which, then executes a practical plan to fix it—fast—without vendor hype.
Diagnose first: is it content quality or an intent shift?
Start by segmenting behavior and traffic sources, not just looking at topline CVR. Signs of a content quality gap cluster around unanswered questions at the point of decision (imagery, specs, price/fees, availability). Intent shift, by contrast, shows up as more repeat PDP views, comparison behavior, and a referrer mix skewing informational.
According to Baymard’s public guidance on product page UX (updated 2026), surfacing complete galleries, structured specs, and transparent pricing reduces unnecessary friction on PDPs. Google’s Core Web Vitals documentation underscores that faster, more stable pages help business outcomes, but you still need to measure your own speed→conversion impact locally. And when users enter comparison mode, NN/g notes that clear, side‑by‑side attributes in comparison tables aid decisions and may raise engagement without immediate purchase.
Symptom-to-cause mapping you can use today:
| Symptom | Observable metrics | Likely cause | First test |
|---|---|---|---|
| Long engagement with drops at variant/price | High scroll, review/spec engagement; low ATC; exits near price/fees | Content quality | Add total price clarity and variant guidance above the fold; test sticky CTA |
| More repeat PDP views per user | Rising repeat‑view cohort share; higher wishlist/save | Intent shift | Add comparison widget and “save for later” CTAs; tailor copy to research mode |
| CVR down in specific channels | CVR by source/medium down; time on page up from social/editorial | Intent shift | Adjust PDP CTAs for evaluative traffic; align creative/landing intent |
| Mobile taps up, ATC flat | Gallery interactions up; INP/UX issues; CTA not persistently visible | Content quality + performance | Improve mobile sticky CTA and image performance; measure INP |
Run these quick GA4/BigQuery checks to separate causes (adapt to your schema and date range):
-- PDP conversion by traffic source (GA4 BigQuery export)
SELECT
  traffic_source.source || ' / ' || traffic_source.medium AS src,
  COUNTIF(event_name = 'purchase') / NULLIF(COUNTIF(event_name = 'view_item'),0) AS pdp_cvr,
  COUNTIF(event_name = 'view_item') AS pdp_views,
  COUNTIF(event_name = 'add_to_cart') AS atc_events
FROM `your_project.dataset.events_*`, UNNEST(traffic_source) AS traffic_source
WHERE _TABLE_SUFFIX BETWEEN '20250101' AND '20260201'
  AND event_name IN ('view_item','add_to_cart','purchase')
GROUP BY 1
ORDER BY pdp_cvr DESC;
-- Repeat‑view cohorts to detect research mode
WITH first_pdp AS (
  SELECT user_pseudo_id,
         MIN(event_timestamp) AS first_ts
  FROM `your_project.dataset.events_*`
  WHERE event_name = 'view_item'
  GROUP BY 1
)
SELECT DATE_TRUNC(TIMESTAMP_MILLIS(e.event_timestamp), WEEK) AS wk,
       COUNTIF(e.event_name='purchase') / NULLIF(COUNTIF(e.event_name='view_item'),0) AS pdp_cvr,
       COUNTIF(e.event_name = 'view_item') AS pdp_views
FROM first_pdp f
JOIN `your_project.dataset.events_*` e
  ON e.user_pseudo_id = f.user_pseudo_id AND e.event_timestamp >= f.first_ts
WHERE e.event_name IN ('view_item','purchase')
GROUP BY 1
ORDER BY wk;
-- Time‑on‑page deciles vs conversion (session‑level binning)
WITH pdp AS (
  SELECT
    (SELECT value.string_value FROM UNNEST(event_params) WHERE key='page_location') AS url,
    (SELECT value.int_value FROM UNNEST(event_params) WHERE key='engagement_time_msec') AS etm,
    ANY_VALUE(traffic_source.source) AS source,
    ANY_VALUE(traffic_source.medium) AS medium,
    MAX(IF(event_name='purchase',1,0)) OVER (PARTITION BY session_id) AS purchased,
    session_id
  FROM `your_project.dataset.events_*`, UNNEST(traffic_source) AS traffic_source
  WHERE event_name IN ('page_view','purchase')
)
SELECT CONCAT(source,' / ',medium) AS src,
       NTILE(10) OVER (ORDER BY etm) AS time_decile,
       AVG(CAST(purchased AS FLOAT64)) AS conv_rate
FROM pdp
GROUP BY 1,2
ORDER BY 1,2;
- For UX and speed context, review Google’s guidance on Core Web Vitals and Interaction to Next Paint; don’t assume generic percentage lifts—measure yours locally.
- For comparison behavior patterns, see Nielsen Norman Group’s guidance on comparison tables. For traffic intent segmentation practices, see CXL’s and Practical Ecommerce’s resources on BOFU and search intent.
External references: Google’s Core Web Vitals overview on web.dev; Google’s Search Central documentation for CWV and INP (2023–2026); NN/g on comparison tables; CXL on bottom‑of‑funnel intent; Practical Ecommerce on distinguishing search intent. Contentsquare’s benchmark explorer and retail guides offer macro trends but keep vendor‑gated details in mind.
Content quality fixes you can ship this week — fixing PDP engagement conversion decline
Treat the PDP like a salesperson who anticipates objections. If engagement rises while conversion falls on specific PDPs, users are probably stuck on a missing detail. Start with the decision core: images, specs, price/availability, and a visible primary action.
Upgrade the gallery and make it work on mobile first. Include multiple angles, zoom, in‑scale or human‑model photos, and a 10–20‑second explainer video. Next, rewrite specs into a scannable structure—group attributes and highlight differentiators that make comparison easier. Then bring pricing and fees into the light: show total cost signals early and surface delivery ETA, returns, and stock status near the CTA. Finally, ensure a sticky, accessible Add to Cart that remains in view without crowding.
Here’s a quick vignette. An apparel brand saw high gallery interactions but exits spiked where size selection lived. They replaced a vague size chart link with a visual fit finder, added a short try‑on clip, and moved returns policy near the size selector. Add‑to‑cart rose, and the PDP engagement conversion decline narrowed in two weeks.
If you need to draft stronger PDP copy variants quickly, an AI content assistant within an eCommerce ERP can help generate spec‑rich descriptions for testing. For example, you can create two versions that emphasize different differentiators and A/B test them against your baseline. See the capabilities overview on the WarpDriven eCommerce ERP page for how teams orchestrate content variants across channels: AI‑Powered Content Assistant in WarpDriven’s eCommerce ERP. Keep the tone neutral and measure locally; don’t assume lift without evidence.
When it’s an intent shift, design for research mode — resolving PDP engagement conversion decline
Sometimes nothing is “broken”—your audience just isn’t ready to buy yet. That’s when engagement grows while immediate CVR dips. Design a research‑mode PDP variant that helps users compare, save, and return.
Add a comparison module that lays attributes side by side (NN/g shows this reduces cognitive load during evaluation). Offer “save to list,” “price drop alert,” and “back in stock” options next to the primary CTA. Tailor CTAs by behavior: returning researcher? Lead with “Compare” or “Save,” and keep “Buy now” available but not pushy. First‑time buyer from a high‑intent channel? Keep the primary purchase path prominent and reduce comparison noise.
Mini‑vignette. A consumer electronics shop noticed CVR fell only for traffic from editorial roundups while time on PDP climbed. They introduced a sticky “Compare two models” widget and clarified spec differences for battery life and ports, plus a “Save for later” option. Purchases from that segment recovered over the next sprint while engagement stayed high—classic intent‑shift remediation.
Behavior‑based personalization can automate these swaps. For example, if a user has multiple repeat PDP views without ATC, trigger comparison‑mode content blocks or surface a wishlist prompt. Platforms like WarpDriven Compass demonstrate how storefront modules can adapt to behavioral segments; see the overview: WarpDriven Compass personalization. Use any equivalent tool you prefer, and validate impact with experiments.
Experimentation playbook for high‑engagement PDPs
You don’t need dozens of tests—just the right ones, run cleanly. Here’s a compact template you can reuse.
Hypothesis
- If we surface total cost and delivery ETA above the fold and keep a sticky Add to Cart visible, purchase rate from mobile PDPs will increase for new visitors from paid search.
Segments
- Device: mobile
- Source/medium: paid search
- Visitors: new vs returning (analyze both)
Variants
- Control: current PDP
- Variant A: price/fees transparency added; delivery ETA near CTA; sticky CTA improved
- Variant B: Variant A + scannable spec table and review summary above the fold
Metrics
- Primary: PDP→purchase conversion, add‑to‑cart rate
- Secondary: time to first ATC, scroll depth to CTA, exit rate after variant selection
- Guardrails: bounce rate, INP/LCP, page weight
Power and duration
- Estimate sample size using your baseline CVR and the minimum detectable effect you care about; run through one full purchase cycle. Pause if technical metrics regress.
Documentation and QA
- Pre‑launch check: correct event tagging per GA4 eCommerce documentation and channel grouping per GA4 Help. Screenshot variants, archive copy, and capture your test plan.
Implementation priorities and timeline
Day 0–2: Diagnostics
- Query top 20 PDPs by views with CVR below your category median. Segment by source/medium, device, and new vs returning. Compute repeat‑view cohorts and time‑on‑page deciles. Look for patterns consistent with content gaps vs intent shift.
Weeks 1–2: Quick wins for content quality
- Replace or augment primary image sets; add a short explainer video.
- Rewrite specs into a scannable table; highlight key differentiators.
- Surface total price signals, delivery ETA, returns, and stock near the CTA.
- Implement an accessible sticky Add to Cart on mobile and desktop.
Weeks 2–8: Experiments and research‑mode variant
- Run the A/B test outlined above; consider a research‑mode PDP variant for evaluative traffic that includes comparison tools and save/notify options.
- Iterate based on segment‑level results. Document learnings and promote winning patterns to more PDPs.
Months 2–3: Personalization and recovery
- Trigger behavior‑based modules (comparison blocks for researchers; streamlined CTAs for buyers). Expand wishlist, price‑drop, and back‑in‑stock notifications.
- Extend learnings to email/SMS recovery and category/PLP alignment so PDP improvements propagate upstream.
Sources and further reading
- Google’s business‑focused overview on Core Web Vitals explains why performance improvements need local measurement: Optimize Core Web Vitals for business (Google, 2023–2026). For definitions and Search appearance, see Core Web Vitals documentation and the INP update in Introducing Interaction to Next Paint.
- For comparison‑mode UX patterns, see Nielsen Norman Group’s comparison tables guidance.
- For traffic‑intent strategy, see CXL on bottom‑of‑funnel content and Practical Ecommerce on search intent tools.
- To understand macro digital experience trends, explore Contentsquare’s benchmark explorer and its retail conversion guides.
One‑line next step: Run the diagnostics above on your top 20 PDPs this week, ship the quick fixes, and queue the first two tests; if you want help automating variant creation and behavioral modules, consider a platform like WarpDriven to speed up the workflow.