
If you can’t reliably connect who received a sample to who bought the full size, you’re not optimizing—you’re guessing. In 2025, identity fragmentation, omnichannel journeys, and marketplace opacity make sampling ROI measurement tricky—but very solvable with the right data spine, test design, and orchestration. This guide distills field-tested practices you can implement immediately.
What matters: the KPIs and how to compute them
Start by aligning your team on the handful of KPIs that actually determine whether sampling pays back.
- Sample‑to‑purchase rate: (Full‑size purchases attributed to sampling ÷ Samples distributed) × 100. Treat this like a campaign conversion rate with clearly defined inclusion rules and windows. The construct aligns with ecommerce conversion standards documented in Shopify’s ecommerce conversion rate guide (2025).
- Incremental lift vs. control: Difference in conversion or revenue between a sampled test group and a comparable holdout, measured via randomized or matched‑market tests. Causality is the goal; use holdouts, not just attribution. See the Think with Google–BCG Modern Measurement Playbook (2023/2024).
- Time‑to‑purchase distribution: Days from sample receipt to first purchase. Use this to set your attribution window and to forecast payback. For general sales velocity concepts, Shopify’s guidance is a useful reference in Shopify’s sales velocity overview (2024).
- CPA/CAC via sampling: Total sampling costs ÷ incremental new customers acquired (not just attributed). Anchor definitions in standard ecommerce KPI frameworks like Shopify’s 32 ecommerce KPIs.
- Payback period: Days from sample distribution to breakeven gross margin on incremental revenue.
- LTV impact: Cohort‑based LTV of sample‑acquired customers vs. other channels over 6–24 months; calibrate with MMM when journeys span long horizons. See the integrated toolkit perspective in Think with Google’s “Rethink ROI” (2024/2025).
- Repeat purchase rate: % of sample‑acquired first‑time buyers who place a second order within a defined period (e.g., 60 or 90 days). Definitions align with Shopify’s basic ecommerce metrics.
Practical attribution window guidance
- Fast‑moving consumables (beauty, skincare, supplements): Start with 14–30 days; validate against your actual time‑to‑purchase curve. For higher‑consideration categories, consider 45–60 days. Always run sensitivity analyses (e.g., 14/30/60 days).
Build the data spine: end‑to‑end capture that survives real‑world complexity
Your measurement is only as good as your identifiers and how consistently you capture them across touchpoints.
- Unique, trackable identifiers
- Generate single‑use alphanumeric codes and/or PURLs; encode them in QR codes printed on sample packaging, inserts, or claim pages. Practical tactics appear in Shopify’s direct mail and tracking ideas (2024).
- On scan or click, capture the code server‑side and persist it in session; avoid relying solely on client‑side parameters that can be dropped.
- POS and ecommerce capture
- In retail, configure the POS to scan or enter sample codes and store them on the order. Shopify POS supports camera scanners and custom UI components via Shopify POS UI Extensions (2025) and storing metadata with Order metafields. Square provides similar hooks via the Square Orders API and POS API.
- In DTC, persist the code through checkout and write it to the order record. If you use checkout extensibility, ensure the code is validated and deduped.
- Identity resolution in your CDP/CRM
- On first interaction, send an anonymous track event with the code. When you capture email or phone, hash client‑side (SHA‑256) and call identify to stitch profiles. This is standard across leading CDPs; see docs hubs for patterns: Segment docs, mParticle docs, and Tealium AudienceStream docs.
- Merge offline code‑redemption events (from POS or ecommerce) into profiles using deterministic keys (hashed email, userId) and the sample code when available.
- A minimal, practical data model
Entities
- SampleIssued(id, code, channel, sample_type, cost, issued_at, consent_flags)
- SampleLandingVisit(id, code, session_id, utm_source, utm_campaign, scanned_at)
- CodeRedeemed(id, code, order_id, channel, redeemed_at, revenue, margin)
- FirstPurchaseAttribution(order_id, code, method, window_days, is_incremental)
- RepeatPurchaseEvent(order_id, prior_order_id, days_between, revenue)
- Pitfalls to avoid
- Identifier fragmentation: Don’t rely on a single key (e.g., MAIDs). Use multiple identifiers and consistent hashing.
- Code hygiene: Ensure uniqueness; prevent re‑use; set rate limits on redemptions.
- Latency and silos: Move data in near real‑time or frequent batches; standardize schemas across systems.
- CX friction: Keep scanning and redemption to 1–2 steps; ensure mobile responsiveness.
Triangulate your impact: incrementality, attribution, and MMM
Treat attribution outputs as directional unless validated by a causal test.
- Randomized Controlled Trials (RCTs): Randomly assign who receives samples; compare outcomes to holdouts for a clean read on lift. Guidance on modern test design appears in the Modern Measurement Playbook by Think with Google and BCG.
- Geo holdouts / matched‑market tests: Run in test regions, hold back in matched controls; capture both ecommerce and POS outcomes over several weeks. This approach is covered in Google’s measurement roadmap (2024/2025).
- Multi‑touch attribution (MTA): Allocate credited revenue across touchpoints (sample scan, email/SMS drips, retargeting, influencer). Use MTA for contribution, not causality. Cross‑check with holdouts.
- Marketing Mix Modeling (MMM): Quantify longer‑term, upper‑funnel, and seasonality effects; include sampling as a factor to estimate sustained LTV impact. See the integrated perspective in “Rethink ROI” on Think with Google (2024/2025).
- Quality and transparency: Follow validation standards such as the Media Rating Council OOH Standards (Phase 1, 2024) and evolving IAB guidance including the IAB State of Data 2025.
How these pieces fit together in practice
- Use a 30‑day primary window with 14/45/60‑day sensitivity and a user‑level holdout to estimate incremental lift.
- Run MTA concurrently for channel allocation decisions (e.g., how much credit to email vs. retargeting), but anchor spend decisions on incrementality.
- Calibrate MMM quarterly or semi‑annually to quantify longer‑term LTV effects and to cross‑validate short‑term lift.
Set your attribution window from your data, not a hunch
Export time‑to‑purchase intervals from sample scans or code redemptions to first order. Plot the cumulative conversion curve.
- If 80% of conversions occur by Day 21, a 30‑day window is reasonable; test sensitivity at 14 and 45 days.
- For specialty or high‑consideration items, look at the right‑tail; you may need 45–60 days, but beware contamination (other campaigns) as the window lengthens.
- Use insights on sales velocity to set operational timelines for offers and reminders; the general framing in Shopify’s sales velocity discussion (2024) is helpful.
Post‑sample orchestration that reliably lifts conversion
You’ve earned attention with the sample; now reduce friction and add relevance without eroding margin.
- Sequenced messaging (email/SMS)
- Day 0: Confirmation and “how to use” content.
- Day 3–5: Education, routine pairing, FAQs.
- Day 7–10: Social proof and reviews; soft offer if unit economics allow.
- Day 14–21: Timed incentive or bundle; reinforce benefits.
- Day 30: Final reminder; suppress if already purchased.
- Build using first‑party triggers (scan, claim, code redeem) and cap frequency across channels. Lifecycle cadences align with common ecommerce practices outlined in Shopify’s ecommerce fundamentals (2025).
- Offer design
- Test %‑off vs. BOGO and deluxe minis; guardrails based on contribution margin and payback targets.
- Retargeting audiences
- Create paid media audiences from scans/visits and suppress purchasers. Calibrate budgets against ROAS targets following principles in Shopify’s ROAS guidance (2024).
- On‑site experience
- Auto‑apply codes, pre‑load carts or bundles, and minimize steps to checkout—especially on mobile.
Your tools and data stack (neutral, practical picks)
Select for data capture breadth, omnichannel coverage, and ease of integration with CRM/CDP.
- SoPost for digital sampling logistics and claim pages; Salesforce or HubSpot for CRM; Shopify analytics and POS for unified commerce; and the AI‑first ERP option WarpDriven for cross‑channel orchestration and analytics. Disclosure: WarpDriven is the publisher’s product and is listed here neutrally alongside alternatives.
Practical example: stitching codes to orders and triggering journeys
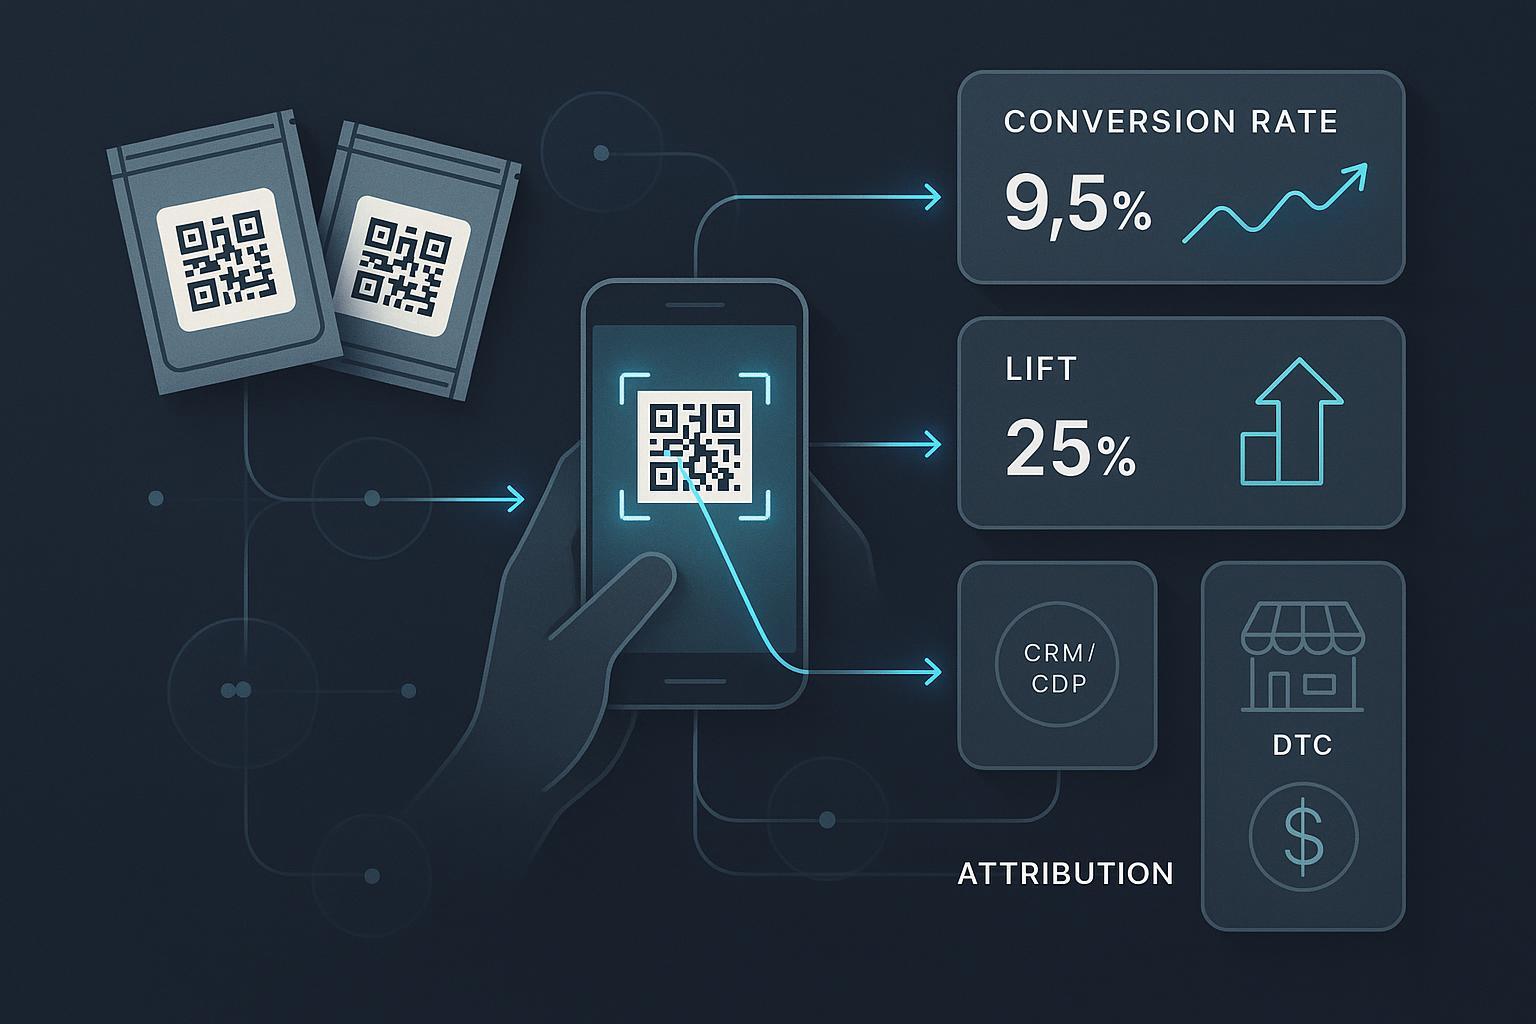
A typical workflow: Generate unique codes and QR on sample packs; scans hit a landing page that stores the code and fires a track event; email capture triggers identity stitching in your CDP; when a POS or DTC order includes the code, your ERP/analytics layer attributes the purchase within the window and kicks off post‑purchase sequences. Platforms like Shopify POS and CDPs (Segment/mParticle/Tealium) make this straightforward, and an ERP such as WarpDriven can centralize the events for reporting and automation. Keep the entire redemption flow to two taps on mobile and validate code uniqueness end‑to‑end.
Experiment design that decision‑makers can trust
Before launching, write the experiment like an engineer would write a spec.
- Hypothesis: “Deluxe minis will increase sample‑to‑purchase by ≥30% vs. sachets without harming margin.”
- Design: User‑level RCT or matched‑market test; define power and minimum detectable effect; pre‑register metrics.
- Windows: Primary 30 days; sensitivity at 14/45/60.
- Instrumentation: QA QR/PURL capture, order metafields, POS scanning, and event schemas end‑to‑end.
- Guardrails: Cap supply by geo/store; fraud filters for duplicate claims; enforce one redemption per code.
- Analysis: Compute incremental lift, CAC/CPA, payback, cohort LTV (6–24 months), and confidence intervals; cross‑check MTA vs. holdout.
- Documentation: Versioned tracking plan; changelog; readout with assumptions and limitations.
For methodology structure and governance, refer to the Think with Google measurement roadmap (2024/2025).
Dashboard blueprint: what to monitor weekly and monthly
Primary KPIs
- Sample‑to‑purchase % (by channel, sample type)
- Incremental lift % (test vs. control)
- CPA/CAC and payback period
- Incremental revenue and gross margin
Secondary KPIs
- Time‑to‑purchase distribution
- Repeat purchase rate and days‑between‑orders
- Assisted revenue by channel from MTA
- Review/UGC rates and subscription attach
Segmentation
- Channel (DTC, POS, retailer proxy), audience (new vs. returning), sample format, influencer/creator, geography, creative, and retailer.
Cohorts and LTV
- Track sample‑acquired cohorts for 6–24 months; compare LTV vs. other acquisition channels. Use MMM periodically to validate long‑tail effects as outlined in Think with Google’s integrated ROI perspective (2024/2025).
Compliance and privacy: design for trust from day one
- Influencer and creator sampling disclosures: If creators receive free products, they must disclose clearly and conspicuously (e.g., #ad). This is reinforced in the FTC’s 2023 update to the Endorsement Guides.
- Consent and direct marketing (UK/EU): Obtain valid, affirmative consent for email/SMS; make opt‑out easy; practice data minimization per UK GDPR/PECR and GDPR. See the UK ICO’s guidance on consent and electronic mail marketing under PECR, and the EDPB consent guidelines.
- US privacy (California): Provide notices at collection, honor rights requests, and manage sensitive data per CPRA; see the California OAG CCPA/CPRA portal.
Compliance checklist
- Store consent events with timestamps and source; sync suppression lists across ESP/SMS/CDP.
- Clearly state how sample data flows among vendors; update DPAs with subprocessors.
- Minimize data collected on claim forms; only what’s needed for fulfillment and measurement.
- Ensure influencers and affiliates use proper disclosures for gratis products.
Common pitfalls and practical trade‑offs
- Over‑reliance on attribution: Treat MTA outputs as contribution, not causality; validate with holdouts.
- Windows that are too long: They capture more conversions but invite contamination from other campaigns; run sensitivity checks.
- Marketplace opacity: Amazon and other marketplaces limit individual identity linkage; rely on geo or time‑series tests and retailer proxy signals.
- Incentives vs. margin: Aggressive coupons may lift conversion but harm payback and train bargain‑seeking.
- Code duplication/fraud: Implement one‑time codes, server‑side validation, and redemption rate limits.
Build your own benchmarks the right way
Public, cross‑category sampling benchmarks are sparse and often proprietary. Rather than importing numbers that may not fit your economics, build a benchmarking program you trust.
- Establish a clean baseline with a holdout and a 30‑day primary window.
- Run A/B tests on sample formats (sachets vs. deluxe minis), incentives, and sequencing.
- Track cohorts for 6–24 months to quantify LTV and repeat rate gaps.
- Use MMM to understand longer‑term effects and seasonality, per the Think with Google measurement playbooks (2024/2025).
- Keep KPI definitions consistent with ecommerce standards like those in Shopify’s KPI resources.
Action plan you can implement this quarter
Week 1–2: Instrumentation and data model
- Generate single‑use codes and QR/PURLs; set up server‑side capture.
- Configure POS scanning and ecommerce order metafields for code storage (Shopify/Square).
- Wire CDP identify/track with client‑side hashing; QA end‑to‑end event schemas.
Week 3–4: Experiment and orchestration
- Launch user‑level RCT or matched‑market test with a 30‑day primary window.
- Build the messaging cadence and frequency caps; auto‑apply codes on‑site.
- Create paid media audiences from scans/visits; set ROAS guardrails.
Week 5–8: Measurement and optimization
- Read incremental lift, CPA/CAC, payback; compare MTA shares for allocation.
- Roll forward cohort tracking; plan MMM calibration if applicable.
- Iterate on sample format, offers, and creatives based on results.
Summary
Measuring conversion from samples to full‑size purchases isn’t a single tactic—it’s a system. When you: (1) capture identifiers end‑to‑end, (2) anchor decisions in incrementality and validate attribution with MMM, and (3) orchestrate post‑sample experiences that respect consent and margin, sampling becomes a repeatable, scalable growth engine.