
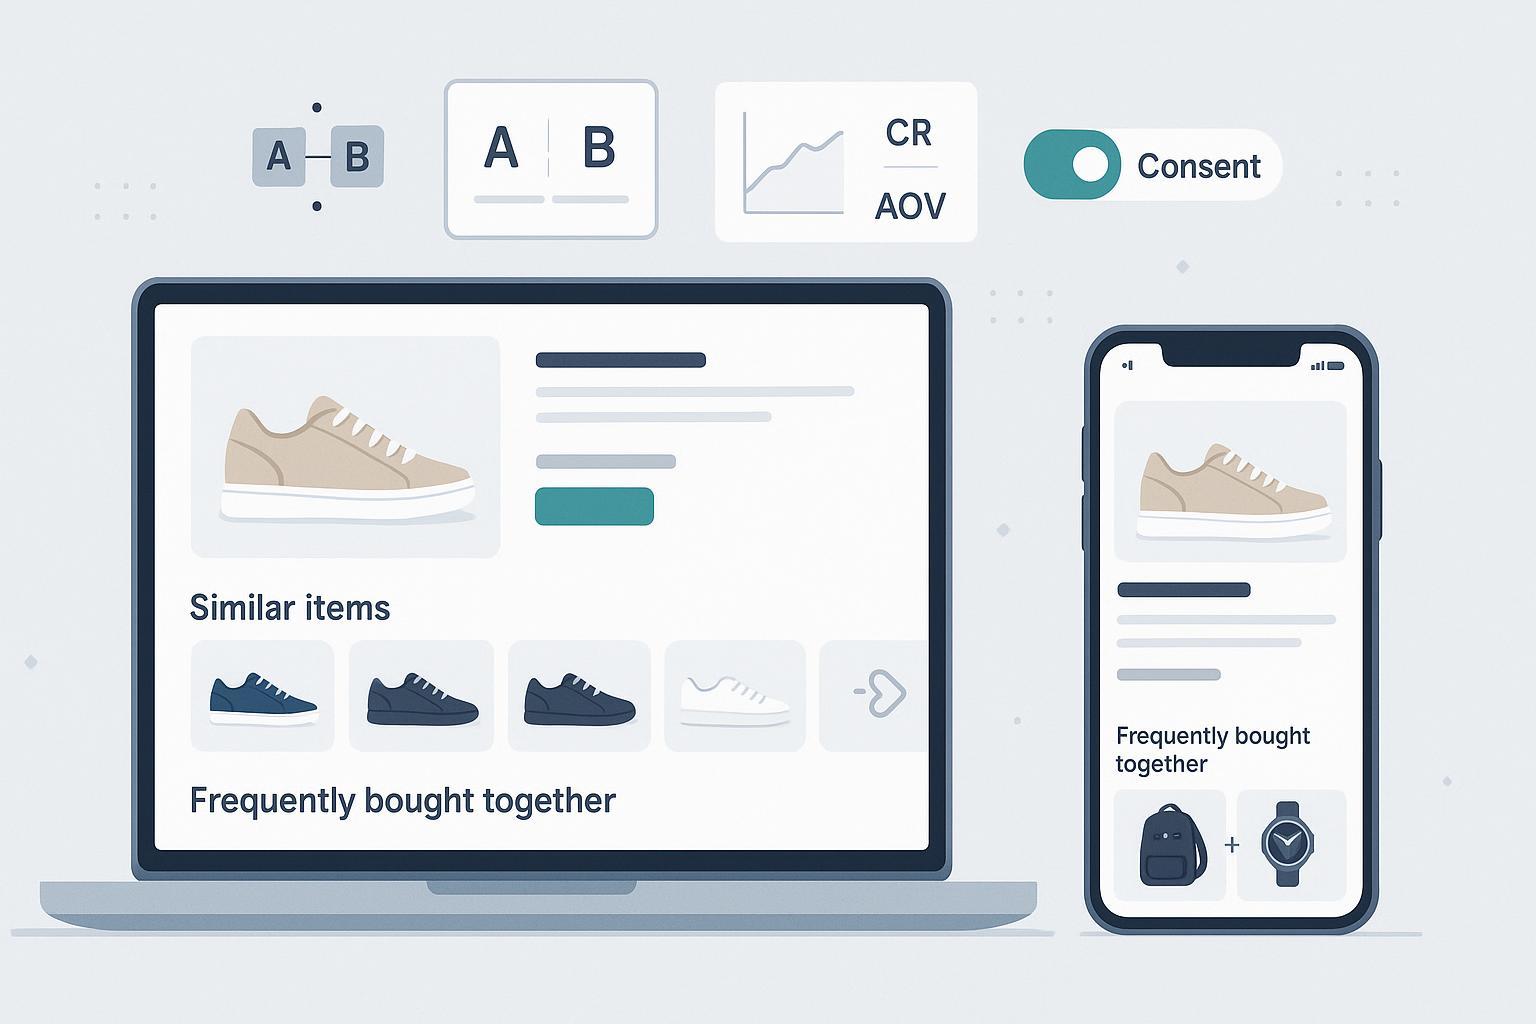
If you manage a PDP, you’ve likely asked: should we show “similar items” to help shoppers find the right fit, or “frequently bought together” to grow basket size? In practice, both can work—but where, for whom, and by how much depends on rigorous experiment design, privacy-aware tracking, and realistic guardrails. This guide distills what’s worked in 2025 programs I’ve run or audited, with concrete steps you can adopt immediately.
Key takeaway: Similar recommendations tend to help product discovery and conversion when substitution is common; complementary recommendations tend to lift AOV and revenue per session when compatibility matters. Validate that in your context with disciplined A/B/n tests and privacy-first analytics.
1) Similar vs complementary: when each tends to win
These are heuristics, not dogma. Use them to prioritize, then test.
- Electronics, DIY, automotive: Complements usually win on AOV/RPS due to compatibility-dependent accessories (chargers, mounts, blades). This aligns with Baymard’s guidance that compatibility-dependent recommendations provide the clearest value when placed close to the purchase decision, such as near the Add to Cart area, per the Baymard 2023 guidance on compatibility-dependent recommendations.
- Fashion/apparel: Similar often reduces bounce and increases conversion when users are browsing styles or when size/color stockouts exist. Complements (“complete the look”) can raise AOV when the hero item is compelling; test conditional logic that switches to similar items when the viewed SKU is out of stock.
- CPG/beauty: Complements (routine bundles) frequently increase basket size; similar variants risk cannibalization unless framed as shade/size alternatives. Zero-party data (quizzes) can supercharge complements—Shopify’s 2024 enterprise feature on Jones Road reports a mobile quiz that lifted AOV from $60 to $90 (+50%) with a 16% conversion from quiz flows, illustrating how explicit preferences drive PDP outcomes in practice, as described in the Shopify Enterprise 2024 Jones Road case.
Treat these as starting points. The rest of this article shows how to run a defensible experiment to decide for your catalog and audience.
2) The blueprint: A/B/n design to compare similar vs complementary
- Define goals and hypotheses
- Primary goal: improve revenue per session (RPS) and/or AOV without harming conversion rate (CR) or PDP engagement.
- Example hypotheses:
- H1: Complementary recommendations on electronics PDPs increase AOV and RPS vs similar recommendations.
- H2: Similar recommendations on apparel PDPs reduce bounce and increase CR vs complements when stockouts are common.
- Choose variants
- Control: Business-as-usual (BAU) or “no recommendations” if you need a clean baseline.
- Variant A: Similar/substitutes (same category/attributes or vector similarity).
- Variant B: Complementary/cross-sell (co-purchase patterns or rules/knowledge graphs).
- Variant C (optional): Hybrid—tabs or a carousel mixing both; or a policy that switches type based on product/user context.
- Targeting and segmentation
- Product context segments: high-compatibility categories (electronics/DIY) vs high-style substitutable (apparel). Include price bands and stock status.
- User context segments: new vs returning; logged-in vs guest; region; consent status (details in the privacy section).
- Placement and UX
- Test above vs below the fold and proximity to the Add to Cart. Prioritize clarity and speed—avoid clutter and duplication. Baymard’s PDP research continues to show that prominent, relevant recs convert best when they feel obviously useful; see the Baymard PDP UX state-of-the-industry analysis (2023).
- Metrics and guardrails
- Primary: RPS, AOV, CR, Add-to-Cart Rate from recommendation clicks, Items per Order.
- Guardrails: page performance (LCP), recommendation API latency/error rate, bounce rate, returns rate, and cannibalization. Define cannibalization as: share of orders where the hero PDP SKU was not purchased, but a recommended substitute was purchased.
- Power and duration
- Estimate baseline rates and minimum detectable effect (MDE). Use variance reduction to shorten runtime. CUPED is well-documented to improve sensitivity by using pre-period covariates; Microsoft’s experimentation team explains this in detail in their variance reduction deep dive (Microsoft, 2023). Optimizely also provides practitioner walkthroughs of what CUPED is and how to apply it in experiments.
- Randomization and data quality
- Assign at the user or session level—don’t mix. Monitor for SRM (sample ratio mismatch). If your traffic split is 50/50/… but observed proportions deviate significantly, your analysis isn’t trustworthy until fixed. Microsoft’s ExP team describes SRM detection and diagnosis with chi-squared tests and common root causes like logging loss or faulty routing in their SRM diagnosis guide (Microsoft, 2020s). They also emphasize automated alerting in the ExP alerting overview.
- Privacy and consent
- In the EU/UK, analytics/personalization/A-B testing cookies generally require explicit prior consent. The UK ICO’s guidance makes clear that non-essential cookies need opt-in and that “reject all” must be as easy as “accept all,” per the ICO consent guidance (updated 2023–2024). France’s CNIL maintains the same stance and has enforced against non-compliant banners; see CNIL’s page on equal ease to accept/refuse (2023–2024). Implement a compliant CMP (IAB TCF 2.2) and ensure Google tags respect Consent Mode v2 in the EU, as explained in Consent Mode v2 implementation guides (2024).
- When consent is absent, fall back to non-personalized logic (e.g., context-only popularity or rule-based complements). For transparency obligations under the EU’s DSA, provide a clear explanation of the signals used for recommendations and an opt-out of profiling-based modules where required; see the Commission’s DSA transparency harmonization update (2024).
- Analysis and interpretation
- Use CUPED-adjusted estimators where supported. Slice results by product category, device, and consent status. Diagnose cannibalization and returns by variant. Check novelty decay by comparing early vs late windows; if effects fade, consider a holdout after rollout.
- Rollout and iteration
- If complements win AOV but similars win CR, choose based on your objective function. Many teams deploy a hybrid policy or contextual switching. For ongoing optimization, consider bandits with safety constraints (more below) to allocate traffic adaptively.
3) 2025 data, identity, and tracking realities
- Third-party cookies are being deprecated in Chrome under the Privacy Sandbox, with Safari/Firefox already blocking. The practical takeaway for PDP experiments: rely on first-party cookies/IDs and server-side collection. See Google’s overview of Chrome’s Tracking Protection and Privacy Sandbox (2024–2025) and MDN’s explainer on the third-party cookie phaseout (2024).
- Consent tech: Adopt IAB TCF 2.2 in your CMP and implement Google Consent Mode v2 for EU traffic so analytics and ads tags adapt to consent state; see a practitioner walkthrough in Consentmanager’s 2024 guide.
- Identity: Prefer deterministic stitching via login; where unavailable, avoid device fingerprinting without consent. For apps, honor Apple’s ATT; without permission, personalize only via on-device/session context.
4) Statistical rigor: sensitivity, peeking, guardrails
- Variance reduction: Apply CUPED/CURE to shorten tests and improve power, as documented by Microsoft in their variance reduction deep dive (2023) and by Statsig’s docs on variance reduction and CUPED and CURE.
- Sequential testing and peeking: Define stopping rules up front. If you plan interim looks, use proper alpha-spending or Bayesian sequential methods to control false positives. Optimizely’s recommendation experiment docs cover setup and reporting considerations for such tests; see the Optimizely Recommendations experiment guide (accessed 2025).
- Guardrail metrics: Track PDP load speed (LCP), rec API latency/errors, bounce, return rates, and customer support contacts. Poor latency alone can nullify gains; set thresholds and auto-disable problematic variants.
5) Mobile and omnichannel nuances
- Mobile performance budgets: Lazy-load carousels, compress images, and prefetch where possible. Place complements near Add to Cart only if they don’t push critical content below the fold. Keep interaction costs low.
- App vs web identity: On app, ATT limits cross-app tracking; collect first-party events server-side and personalize with consent. For iOS, review Apple’s SKAdNetwork and AdAttributionKit docs (2024–2025) for attribution boundaries.
- Cross-channel: If the same user sees PDPs on web and app, favor login-based identity to avoid double assignment; don’t mix unit of randomization across platforms.
6) Advanced personalization without blowing up risk
- Contextual/multi-armed bandits: After your initial A/B/n establishes a safe baseline, bandits can adaptively allocate traffic to similar or complementary policies by context (category, price band, consent). To avoid regressions, use conservative priors and guardrails; validate offline via counterfactual replay (inverse propensity scoring/doubly robust) before online rollout. Industry blogs from big platforms popularized these safeguards; treat them as a follow-on to—not replacement for—clean A/Bs.
- Session-based models: Short-session intent (e.g., users landing from search) can be captured by transformer-based session models. Netflix describes scalable transformer architectures for personalization that highlight the latency trade-offs relevant for production recommenders in their foundation model overview (2023–2024). Set latency guardrails and precompute candidates.
- Graph-based complements: Complements benefit from richer relationships (compatibility, use-cases). Amazon’s 2024 write-up on constructing commonsense product knowledge graphs to aid recommendations explains how co-purchase and query-purchase data feed better complement detection; see Amazon Science’s COSMO overview (2024).
7) Pitfalls and how to debug them
- Sample Ratio Mismatch (SRM): Don’t analyze a test with SRM—fix instrumentation first. Follow the diagnostic playbook from Microsoft’s SRM article.
- Cannibalization: If “similar” wins CR but reduces hero SKU sales, quantify it explicitly. Report cannibalization ratio and margin impact—gross revenue gains can hide margin losses.
- Novelty effects: Recommendation widgets can spike clicks early due to novelty. Check effect stability across time windows; avoid premature rollouts by enforcing a minimum duration.
- Duplicated exposure: Ensure a user doesn’t see both variants across sessions if you randomize at user level; seed and persist assignments. Also watch for duplicated SKUs across “similar” and “complementary” widgets.
- Stale or unavailable items: Real-time stock integration is non-negotiable. Showing OOS recommendations erodes trust and depresses CTR.
- Latency regressions: Treat recommendation API latency as a hard guardrail. If p95 latency exceeds your budget, degrade gracefully (static fallback, skeleton UI) or switch off the variant.
- Consent gaps: Traffic with “reject all” can silently break analytics if your implementation relies on client-side cookies. Use server-side event collection and Consent Mode to maintain modeled measurement while respecting choices.
8) Action checklists you can apply this quarter
Experiment setup
- Pick 1–2 categories per vertical to start (e.g., electronics accessories, women’s apparel dresses).
- Define Control, Similar, Complementary, and Hybrid variants.
- Unit of randomization: user for logged-in flows; session for anonymous traffic. Persist assignments.
- Consent gating in EU/UK; non-personalized fallbacks when consent missing.
- Metrics: Primary = RPS; Secondary = CR, AOV; Guardrails = LCP, API latency/errors, returns, cannibalization.
- Power plan: Compute MDE, plan 2–4 weeks minimum; enable CUPED where available.
- SRM alerting: Automated chi-squared check; pause if triggered.
UX and placement
- One widget above or near Add to Cart; one below fold. Avoid pushing critical details down.
- Deduplicate items across widgets; add compatibility badges for complements.
- Mobile-first design: touch targets, lazy-load, horizontal scroll performance.
Analysis and rollout
- Slice by category, device, consent status.
- Quantify cannibalization and margin impact (not just revenue).
- Check early vs late windows for novelty decay.
- If trade-off emerges (CR vs AOV), consider a hybrid policy or contextual switching.
- Post-rollout holdout for 1–2 weeks to validate sustained lift.
9) What good looks like: platform-aligned practices
- Optimizely documents end-to-end recommendation experiments (audiences, placements, metrics, allocation, analysis). Their build guide is a helpful reference to structure your own runbook; see the Optimizely Recommendations experiment guide (2025) and associated reporting docs.
- Dynamic Yield, Nosto, and others provide strategy catalogs (“Similar items,” “Frequently bought together,” hybrid mixes) and merchandising controls. Explore their public docs to mirror proven tactics, e.g., Dynamic Yield’s recommendation strategies catalog and Nosto’s notes on A/B testing placements.
10) Final perspective
There’s no universal winner between “similar” and “complementary” on PDPs. The right answer varies by category, seasonality, inventory, and audience consent. What does generalize is the operating system for learning: clean randomization, variance reduction, privacy-first tracking, strict guardrails, and deliberate iteration.
If you adopt the blueprint above—especially CUPED-powered tests, SRM monitoring, consent-aware targeting, and latency guardrails—you’ll make faster, safer calls about when to show similar items to help shoppers decide vs when to surface complements to grow basket size. That’s how mature teams compound PDP gains in 2025.
References and further reading (selected)
- Microsoft ExP on SRM and variance reduction: SRM diagnosis, variance reduction deep dive
- Optimizely: Build a Recommendations experiment, Product recommendation reports
- Privacy: ICO consent guidance, CNIL equal-ease consent requirements, Chrome Privacy Sandbox
- UX and placements: Baymard PDP UX analysis, Compatibility-dependent recs
- Advanced personalization: Netflix recommendation foundation model, Amazon COSMO complements