
If you’re tuning search in 2025—on-site search for eCommerce/SaaS or measuring Google’s changes—aggregate KPIs will mislead you. A change that lifts “average CTR” can still hurt conversion-heavy queries or break navigational tasks. The only reliable way I’ve found to assess algorithm changes is to segment queries into intent buckets and measure each bucket with the right KPIs, then roll up with explicit weights.
Below is the exact playbook I use. It’s designed for practitioners and grounded in current evidence: Google’s focus on helpful, intent-aligned content in its 2024 core update, fast experimentation patterns from Microsoft and Uber, and 2025 shifts from AI Overviews.
- Google emphasizes intent quality in the August 2024 Core Update overview (Google, 2024).
- At scale, A/B testing and guardrail design patterns have been formalized by Microsoft’s ICSE paper on integrating experiments (Microsoft, 2023) and Uber’s experimentation blog (Uber, 2024).
- AI Overviews intensify volatility for informational queries per the Semrush 2025 AI Overviews study (Semrush, 2025) and Search Engine Land’s coverage of AI Overviews impacts (SEL, 2024–2025).
What follows: an intent taxonomy you can implement, KPI mappings by bucket and industry, experimentation design, offline→online linkage, SGE/AIO adjustments, drift detection, pitfalls, and an implementation plan.
1) Start with a practical intent taxonomy
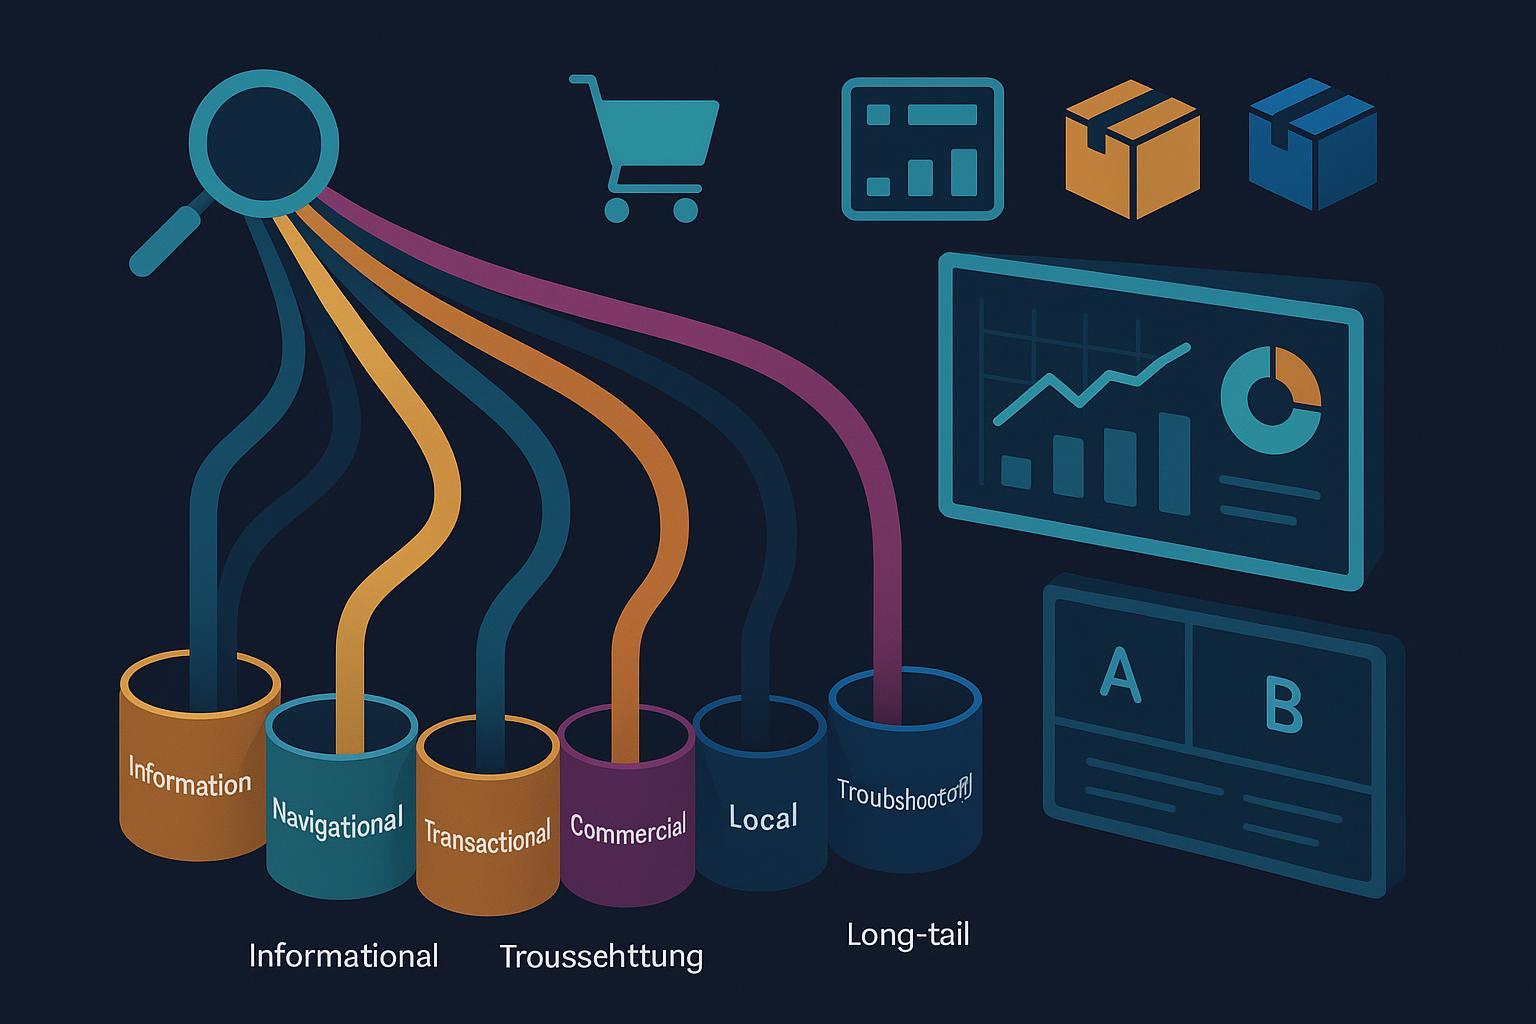
In practice I use seven buckets. Keep it simple enough to govern; complex enough to capture behavior differences. Examples are tailored for eCommerce, SaaS, and supply chain.
- Informational: Learn/understand. Examples: “what is supply chain risk pooling,” “how to calculate reorder point.”
- Navigational: Get to a specific brand/page. Examples: “Shopify pricing,” “Acme Logistics tracking.”
- Transactional: Ready to act/purchase. Examples: “buy wireless barcode scanner,” “start CRM free trial.”
- Commercial investigation: Compare options. Examples: “best CRM for SMB 2025,” “WMS vs ERP.”
- Local intent: Geo-constrained needs. Examples: “freight forwarder Dallas,” “same-day pallet delivery NYC.”
- Troubleshooting/diagnostic: Fix an issue or error. Examples: “Shopify checkout 3DS error,” “API rate limit exceeded fix.”
- Long-tail specific: Multi-constraint intents. Examples: “affordable cloud inventory management for small retailers.”
Why these buckets now: Google’s 2024 guidance stresses satisfying user intent, not just matching keywords, reinforcing the need for nuanced measurement as noted in the Google August 2024 Core Update explainer (Google, 2024). Microsoft’s 2025 “agentic” search push also points to dynamic, context-aware intents in the Build 2025 Book of News (Microsoft, 2025).
Implementation tip (1 hour): Label 500–1,000 queries by hand to create a seed set per bucket. This becomes your gold set for audits and initial model training.
2) Map KPIs to intent—IR + business metrics together
For each bucket, combine an IR/relevance metric with a business KPI. Don’t rely on a single metric.
- Informational: IR = NDCG@k or MRR. Business = time to first click, doc engagement, support ticket deflection rate. NN/g recommends balancing behavior with outcomes; see their framing in “Attitudinal vs. Behavioral UX Methods” (Nielsen Norman Group, 2022).
- Navigational: IR = MRR or single-result success. Business = time to first click, zero-refinement rate. The target is near-instant success.
- Transactional (eCommerce): IR = CTR@k on product results. Business = add-to-cart after search, CVR, revenue per visitor (RPV). Baymard’s research links search/navigation quality with downstream conversion; see eCommerce navigation best practices (Baymard Institute, 2024) and checkout UX impact (Baymard Institute, 2024).
- Commercial investigation (SaaS): IR = CTR@k to comparison content. Business = assisted conversions, demo/trial starts.
- Local: IR = CTR@k on geo-relevant results. Business = calls/lead submissions by region.
- Troubleshooting: IR = ERR (Expected Reciprocal Rank) for quick answers. Business = ticket deflection or time-to-resolution.
- Long-tail: IR = recall@k (avoid zero-results). Business = micro-conversions (save to list, add-to-cart), or lead quality where available.
Guardrails to track on every bucket:
- Query reformulation rate per session
- Search exits/abandonment
- Latency and error rate (fast systems prevent false negatives)
- Data quality: bots filtered, outliers winsorized at p99
NN/g also cautions to differentiate goals, OKRs, and KPIs, which helps keep metric scopes clean; see their short primer in “UX Goals vs OKRs vs KPIs” (Nielsen Norman Group, 2023).
3) Classify intents at scale: from LLM weak supervision to production
A practical approach is to use LLMs to pseudo-label at scale, then distill into a lightweight, low-latency classifier.
- Use LLM weak supervision to generate high-recall labels, then train a compact classifier. See the pattern in “Weak Supervision with LLMs” (arXiv preprint, 2024).
- Retrieval-augmented multi-turn classification can reduce ambiguity; e.g., the LARA approach to multi-turn intent (arXiv preprint, 2024).
- Hybrid routing—switching between a fast model and an LLM based on uncertainty—often yields ~5%+ accuracy gains in recent work like hybrid routing with SetFit and LLMs (arXiv preprint, 2024–2025).
Operational tips:
- Retrain cadence: weekly to monthly; faster for high-volume.
- Maintain a human-labeled gold set for QA and drift detection.
- Track distribution shifts with PSI; <0.1 stable, 0.1–0.25 moderate, ≥0.25 triggers review. For a drift-centric perspective, see concept drift routing frameworks (arXiv preprint, 2025).
4) Build an end-to-end measurement pipeline
This is the minimal, robust stack I recommend (cloud-agnostic ideas, Google Cloud as an example because it’s widely used):
- Data capture: Enable GA4 BigQuery export; you’ll get raw events including site search and conversions. Join with CRM tables on user or transaction IDs.
- Modeling: In BigQuery, classify each query into an intent bucket (SQL UDF or ML model). Compute IR metrics (e.g., position-weighted CTR proxies) and business KPIs by bucket.
- Visualization: Connect BigQuery to Looker or Looker Studio; create dashboards segmented by intent, device, geo, and experiment variant; schedule weekly refresh.
- AI assist: Use Vertex AI or similar for anomaly detection and natural-language insights. Google outlines this data→AI flow in their 2024–2025 posts like the Google Cloud data-to-AI analytics stack overview (Google Cloud, 2024) and Looker release notes (Google Cloud, 2025).
Practical schema advice:
- Tables: queries, sessions, clicks, conversions, products, content, intents, experiments, geo, devices, latency/errors.
- Keys: session_id, user_id (hashed), query_id, experiment_variant, intent_bucket.
- Keep a slowly changing dimension for intent definitions so you can reprocess history when taxonomies evolve.
5) Design experiments that don’t lie
Ranking changes often yield small effects; plan accordingly.
- Choose a primary outcome per bucket and guardrails for all. For transactional, I prefer add-to-cart-after-search or CVR over CTR; for navigational, time-to-first-click.
- Power analysis: For proportions, a standard formula applies; expect longer runs for small lifts. The pitfalls and planning are well covered in Kohavi et al., “Controlled Experiments: Pitfalls and Metrics” (Kohavi et al., 2017).
- Run A/A tests and Sample Ratio Mismatch (SRM) checks. Microsoft documents these guardrails in their ICSE 2023 experiments paper (Microsoft, 2023).
- Interleaving: For rapid ranker comparisons, use interleaving to get directional signals before a full A/B.
- Geo experiments: If user-level randomization is hard, allocate by region; adjust for geographic heterogeneity as described in Uber’s experimentation platform articles (Uber, 2024).
Latency and errors are non-negotiable guardrails—an algorithm that’s 50ms slower can depress CTR enough to mask quality gains.
6) Link offline IR metrics to online/business outcomes
Use offline metrics as a gate, not a verdict. Before launching an online test, I require offline improvements (e.g., +Δ NDCG@10) on the gold set and sampled logs.
- Evidence: In product-ranking contexts, offline metrics can predict online outcomes with high fidelity. A 2023 SIGIR paper reported that offline metrics aligned with online performance up to 97% in pairwise model comparisons (SIGIR, 2023). Validate in your domain, because label quality and interaction dynamics matter.
7) Adjust for SGE/AI Overviews volatility
AI Overviews change how people click. Two implications for measurement:
- Segment by intent and track zero-click patterns. A 2025 study found AI Overviews appeared on 13.14% of queries, with 88.1% informational share (Semrush, 2025). Expect the biggest swings in informational buckets.
- Monitor AIO impressions and panel clicks alongside organic rankings. Industry coverage notes material CTR declines on AI-triggered queries; see Search Engine Land’s analysis of generative AI impacts (SEL, 2024–2025). Treat informational KPIs with caution and add authority/visibility proxies (e.g., cited in panel, snippet share).
Practical steps:
- Add a field for “AIO triggered” in your query logs when available from tools/estimates.
- Re-weight your rollups so transactional buckets aren’t drowned out by informational volatility.
8) Detect intent drift and keep labels honest
Intent distributions evolve: seasonality, product launches, and external events can shift query mixes.
- Monitor PSI or KL divergence between historical and current intent distributions; common PSI thresholds are <0.1 (stable), 0.1–0.25 (watch), ≥0.25 (retrain). For approaches to dynamic routing under drift, see concept drift routing frameworks (arXiv preprint, 2025).
- Hold back a labeled audit set and sample weekly. If precision/recall on the gold set drop, schedule relabeling and model refresh.
- Keep taxonomy changes versioned. When buckets change, reprocess historical data for apples-to-apples comparisons.
9) Common pitfalls (and what to do instead)
I’ve made or seen each of these in production:
- Optimizing to CTR alone: CTR lifts can accompany worse conversion. Pair CTR@k with add-to-cart or CVR in transactional buckets.
- Ignoring speed: a 50–100ms latency increase can negate perceived relevance gains. Treat latency as a guardrail metric.
- Leaking personalization into experiments: if variant A sees more logged-in users, your CVR read is contaminated. Randomize at the right unit and check SRM.
- Over-segmentation: too many micro-buckets = too few samples. Start with 5–7 buckets, then split further where volume supports it.
- Static taxonomies: product catalogs and market language change. Schedule monthly taxonomy reviews and quarterly gold-set refreshes.
- Uninterpretable aggregates: always show both per-bucket KPI deltas and a weighted overall delta with the weights stated.
10) Implementation blueprint (what to do this quarter)
Use this as a field-tested plan. Adjust cadence to your traffic levels.
-
First 30 days
- Define 5–7 buckets and label 500–1,000 queries across top categories.
- Stand up a BigQuery (or warehouse) table for queries, sessions, and search events; wire GA4 export and CRM joins. See Google’s 2024 data→AI stack description in the Cloud analytics-to-AI overview (Google Cloud, 2024).
- Build a Looker/Looker Studio dashboard segmented by intent with core KPIs and guardrails; review weekly. Reference Looker release updates (Google Cloud, 2025) for connection/auth patterns.
- Compute internal baselines: per-bucket CVR, add-to-cart after search, time to first click, reformulation rate, zero-results rate.
-
60 days
- Train an initial classifier via LLM weak supervision → small model distillation. See LLM weak supervision guidance (arXiv preprint, 2024).
- Add PSI monitoring and gold-set QA. Trigger alerts at PSI ≥0.25.
- Run at least one interleaving test for ranker variants; promote the winner into an A/B with clear primary and guardrail metrics. Use Kohavi’s pitfalls checklist (2017).
- Introduce AIO fields into dashboards (impressions/panels where estimable) to separate informational volatility.
-
90 days
- Establish a monthly relabel/retrain cadence; document taxonomy versions.
- Correlate offline IR metric gains (NDCG/ERR/MRR) with online KPI lifts; use the SIGIR 2023 offline→online alignment evidence (SIGIR, 2023) as a sanity check, but validate locally.
- Roll out geo experiments where user-level randomization is constrained; lean on patterns from Uber’s experimentation posts (Uber, 2024).
- Socialize a “single source of truth” dashboard to product, marketing, and exec teams; include per-bucket trends and an explicitly weighted overall score.
11) Reporting pattern that earns trust
Your weekly report should include:
- Per-bucket deltas vs. baseline for primary KPI and 2–3 guardrails
- A weighted overall delta (weights = last 8 weeks’ traffic or revenue mix by bucket)
- AIO-triggered query share and effects (informational vs. others)
- Experiment status: active tests, SRM check status, time to statistical power
- Drift dashboard: PSI and top taxonomy confusions
This format prevents aggregate wins from hiding navigational losses or transactional regressions.
12) When to change bucket definitions
Change buckets when:
- PSI ≥0.25 for 2+ consecutive weeks
- New patterns emerge (e.g., a surge in troubleshooting queries after a major release)
- Stakeholder goals shift (e.g., support deflection becomes a top-line OKR)
Version your taxonomy, backfill history, and communicate clearly what changed and why. Treat the taxonomy as a product with owners.
13) Notes on tooling and governance
- Warehouse and BI: BigQuery + Looker/Studio are common and documented; see the BigQuery release notes (Google Cloud, 2025) for features like vector search and streaming that can simplify pipelines.
- Retrieval and semantic quality: Vector search/RAG can lift recall for long-tail and troubleshooting queries; see Google Cloud Vertex AI Vector Search (Google, 2025) and BigQuery vector search (Google, 2025) for architecture options. Use these as capabilities references, not KPI promises.
- UX alignment: Poor filters/category design inflate refinements and exits. Baymard’s 2024 studies on navigation and checkout—navigation best practices and checkout UX issues and lifts—explain where to look when KPIs suggest search is “fine” but customers still don’t convert.
14) FAQ from the field
- “Our offline NDCG looks great but online CVR is flat.”
- Check latency, personalization leakage, misaligned bucket KPIs, and AIO-triggered share. Validate label quality on the gold set.
- “We don’t have enough volume for per-bucket A/Bs.”
- Use interleaving for rapid signals; pool related buckets (e.g., transactional + commercial investigation) while you build volume.
- “What if informational volatility swamps our rollups?”
- Cap any single bucket’s weight; report a second rollup excluding informational to communicate revenue risk more clearly.
15) Summary
- Segment queries into practical intent buckets.
- Map each bucket to IR and business KPIs, with guardrails.
- Build a reproducible pipeline (GA4→warehouse→BI) and keep labels honest with drift monitoring.
- Design experiments with power, guardrails, and multiple methods.
- Adjust for SGE/AI Overviews, especially in informational buckets.
- Report per-bucket first, then roll up with transparent weights.
These practices have consistently reduced false positives in my teams’ search work and accelerated decision cycles. They won’t remove uncertainty, but they will make it measurable—and that’s the difference between “we think it’s better” and “we can prove it.”
—
References mentioned inline:
- Google Search Central, 2024 core update orientation toward helpful, intent-aligned content: August 2024 Core Update overview
- Microsoft, 2023 experimentation at scale: ICSE paper on integrating A/B testing
- Uber, 2024 experimentation patterns: Experimentation at Uber
- Kohavi et al., 2017 pitfalls and metric design: Controlled Experiments: Pitfalls and Metrics
- SIGIR, 2023 offline→online alignment: How Well do Offline Metrics Predict Online Performance of Product Ranking Models?
- Semrush, 2025 AI Overviews effects: AI Overviews study
- Search Engine Land, 2024–2025 traffic/CTR impacts: Generative AI impact on rankings and traffic
- NN/g, 2022–2023 UX method framing: Attitudinal vs Behavioral UX Methods and UX Goals vs OKRs vs KPIs
- Baymard Institute, 2024 navigation and checkout research: eCommerce navigation best practices and current state of checkout UX
- Google Cloud, 2024–2025 data→AI analytics and BI updates: Data analytics innovations to fuel AI, Looker release notes, and BigQuery release notes
- AI intent classification & drift (preprints): LLM weak supervision, LARA multi-turn intent, Hybrid routing with SetFit/LLMs, Concept drift routing frameworks