
If you lead SEO or analytics in 2025, you’re likely being asked: Are Google’s AI Overviews cannibalizing our branded clicks—or helping our non-brand discovery? This guide gives you a reproducible measurement plan that separates branded from non-brand traffic using Google Search Console (GSC) and GA4, plus optional API/BigQuery steps and a Looker Studio dashboard.
Important reality check: there is no dedicated “AI Overviews” filter in Search Console as of 2025. Google states that AI features (including AI Overviews/AI Mode) are counted in the standard Web Performance report, not a separate appearance type. See Google’s explanation in the AI features in Search documentation: “sites appearing in AI features … are included in the overall search traffic in Search Console” (Google, 2025).
Who this is for, time, and prerequisites
- Roles: SEO leads, growth/marketing managers, analytics engineers
- Time: 3–6 hours for a first pass (UI workflow); 1–2 additional hours if you add API/BigQuery and a DiD view
- Difficulty: Intermediate (UI-only); Advanced (API/BigQuery/DiD)
- Tools: Google Search Console, GA4, Looker Studio; optional Search Analytics API or GSC Bulk Data Export to BigQuery
What you’ll deliver:
- A branded vs non-brand impact report (pre/post) by country and device
- A reproducible Looker Studio dashboard for ongoing monitoring
- A short executive summary with confidence qualifiers and next steps
Step 1: Define your branded taxonomy (foundation of everything)
Goal: Create a robust list of branded tokens and a case-insensitive regex so you can tag GSC queries as Branded or Non-brand consistently across markets.
Do this:
- List your core brand tokens: parent brand, sub-brands, domain/short brand, ticker (if applicable), key executive names, product line names, common misspellings, and localized variants.
- Include delimiters and word boundaries to avoid false positives (e.g., “gap” vs “the gap”).
- Build a case-insensitive regex and test it on a sample of exported GSC queries.
Example regex pattern (edit for your brand):
(?i)\b(
  brand|brand\s*name|brandname|brand-name|
  productx|product\s*x|brnd|brannd|
  example\.com|ex\s*ample|exmple
)\b
Verification:
- Manually review the top 200–500 brand-likely queries. Your regex should match >95% of known branded queries and <1–2% false positives. Keep a changelog of tokens per market.
Tip: Revisit your list monthly as new misspellings and products emerge.
Step 2: Export GSC data with the right dimensions and caveats
You need query-level data to tag branded vs non-brand. Use either the UI or the API (or Bulk Export) with the following fields: query, page, date, country, device; metrics: clicks, impressions, CTR, average position. Definitions are outlined in Google’s Performance report metrics (help, 2025).
UI workflow (fastest):
- GSC > Performance > Search type = Web.
- Set Date to your pre/post windows (we’ll define windows in Step 4).
- Add filters for Country and Device as needed; export Query and Page tabs.
- Be aware: applying filters (e.g., regex on queries) causes anonymized queries to be excluded and totals to drop. Google notes that “adding a filter triggers Search Console to ignore anonymized queries.” See Filter search performance data (help, 2025).
API workflow (more scalable):
- Use searchAnalytics.query with dimensions [query, page, date, country, device]; operators include equals/contains but not regex. You’ll do regex tagging after export. Reference the Search Analytics API: query endpoint (Google, 2025).
Bulk Data Export to BigQuery (advanced):
- Set up the GSC Bulk Export once; it creates the searchdata_site_impression table with fields including data_date, query, is_anonymized_query, country, device. See the Bulk Data Export announcement (Google, 2023) and the schema reference (help, 2025).
Monitoring vs analysis windows:
- The “Recent data” 24-hour view is helpful to spot emerging changes, but it’s provisional and should not replace stable windows. Google introduced the feature with hourly granularity and a short delay; see Recent data in Search Console (Google, Dec 2024).
Step 3: Tag branded vs non-brand and build your splits
Do this:
- Apply your regex to the exported query list. Tag any query that matches as Branded; everything else as Non-brand.
- Create a Page Group for clearly branded pages (e.g., homepage, /brand/, /about, /careers). Use this as a secondary lens where query data is sparse.
- Maintain device and country splits in your dataset so you can align with rollout timing.
Verification:
- Spot-check 100 queries per country/device. Confirm tags look reasonable. Add new misspellings discovered in this pass.
Caveat: In the UI, filtered views exclude anonymized queries; your branded/non-brand totals will undercount. The API and Bulk Export allow you to keep rows where query is empty (anonymized) and handle them separately. See Filter behavior and anonymized queries (help, 2025).
Step 4: Choose pre/post windows using rollout timing by market and device
Because AI Overviews rolled out at different times, define windows per country and, if needed, per device.
- US rollout: “bringing AI Overviews to everyone in the U.S.” in May 2024 per Google’s Generative AI in Search launch (May 2024).
- Wider expansions followed, for example October 2024 and further regional updates in 2025; see AI Overviews expansion update (Oct 2024) and a MENA/Arabic expansion post (2025).
Window options:
- 28–60 days pre vs 28–60 days post rollout date for each market/device.
- When seasonality is strong, compare matched weeks year-over-year and cross-check with pre/post. Annotate any algorithm updates from the Search documentation updates page (Google, 2025).
Decision point:
- If your site has frequent campaigns, use longer windows (45–90 days) or exclude campaign weeks from both sides.
Step 5: Define control groups (to reduce confounders)
You’ll gain confidence by comparing likely-impacted queries/markets to relatively unaffected controls.
Control options:
- Geography: Markets where AI Overviews launched later (or are still limited) vs early-launch markets.
- Query type: Long-tail or highly specific queries that rarely trigger AI Overviews vs mid-head queries that do.
- Device: Desktop vs mobile if rollout/behavior differs.
Assumptions and notes:
- This is observational unless you implement a formal causal design. Document why you believe your control is less impacted (e.g., based on SERP checks and market rollout timing).
Step 6: Analyze branded vs non-brand changes in GSC
Metrics to calculate per segment (Branded, Non-brand), per country and device:
- Clicks, Impressions, CTR, Average position
Compute:
- Absolute delta and % change pre → post
- “Visibility gap” patterns: Impressions up while clicks/CTR down can indicate cannibalization by SERP features (including AI Overviews) even if ranking is stable.
How to do it (UI):
- Use exported CSVs for pre and post windows.
- Aggregate by segment, country, device.
- Chart deltas and confidence notes.
How to do it (API/Bulk Export):
- Aggregate in SQL or Python. Keep anonymized rows separate. Summarize metrics by query segment.
Reminder: Google confirms that AI features traffic is counted in Web Performance. There is no separate appearance filter; see AI features in Search documentation (Google, 2025).
Step 7: Triangulate quality and conversions in GA4
Because GSC doesn’t report engagement, verify traffic quality by landing page in GA4.
Do this:
- GA4 > Reports > Acquisition > Traffic acquisition. Filter Default channel group = Organic Search. See GA4 default channel grouping rules (help, 2025).
- Pivot by Landing page (+ query string) and add metrics: Engaged sessions, Engagement rate, Conversions. Definitions are in GA4 engagement metrics documentation (help, 2025) and Landing page dimension (help, 2025).
- Create a “Brand Page Group” (homepage, /brand/, /about, /careers) as a proxy for branded intent; complement with your GSC query tags when you blend data in Looker Studio.
- Annotate sitewide changes (e.g., new navigation, content launches) to avoid misattribution.
Caveats:
- Time zones differ: GA4 uses your property time zone; GSC daily data uses Pacific Time, and the 24h view uses local browser time. Expect day-level misalignment. See Search Console recent data post (Google, 2024).
- Attribution models differ: GA4 reports sessions and conversions on last non-direct click by default; GSC measures clicks/impressions. Review GA4 attribution overview (help, 2025).
Interpretation tips:
- If branded clicks fall in GSC but GA4 shows stable engaged sessions on brand pages, the brand demand may be intact and shifts could be from SERP layout.
- If non-brand clicks rise with improving GA4 engagement on relevant landing pages, you may be benefiting from AI-driven discovery.
Step 8: Optional advanced method — difference-in-differences (DiD) and BigQuery
Use DiD to compare the change over time in a likely-impacted “treatment” group vs a “control” group.
Simple framing:
- Treatment: markets or queries likely exposed to AI Overviews
- Control: markets or queries with minimal exposure
- Outcome: clicks (or CTR) per segment
Back-of-envelope formula (for a metric M):
DiD = (M_post_treatment - M_pre_treatment) - (M_post_control - M_pre_control)
Lightweight SQL using GSC Bulk Export schema (edit table names, dates, and brand regex):
-- Tag Branded vs Non-brand using a regex on query (null/empty = anonymized)
WITH base AS (
  SELECT
    data_date,
    country,
    device,
    COALESCE(NULLIF(query, ''), '(anonymized)') AS query,
    CASE WHEN REGEXP_CONTAINS(LOWER(query), r"\b(brand|brand\s*name|productx|example\.com)\b") THEN 'Branded' ELSE 'Non-brand' END AS segment,
    clicks,
    impressions
  FROM `my_project.gsc_export.searchdata_site_impression`
  WHERE site_url = 'sc-domain:example.com'
    AND search_type = 'WEB'
    AND data_date BETWEEN '2024-06-01' AND '2025-08-31'
), windows AS (
  SELECT *,
    CASE WHEN data_date BETWEEN '2025-05-01' AND '2025-06-30' THEN 'post'
         WHEN data_date BETWEEN '2025-03-01' AND '2025-04-30' THEN 'pre'
         ELSE 'exclude' END AS win
  FROM base
), agg AS (
  SELECT win, segment, country, device,
         SUM(clicks) AS clicks,
         SUM(impressions) AS impressions,
         SAFE_DIVIDE(SUM(clicks), SUM(impressions)) AS ctr
  FROM windows
  WHERE win != 'exclude'
  GROUP BY win, segment, country, device
)
SELECT * FROM agg;
Then compute DiD in SQL or your notebook by contrasting treatment vs control groups across pre/post. State assumptions explicitly in your report.
References: Bulk Export setup and schema details are in the Bulk Data Export setup guide (help, 2025) and the schema reference (help, 2025).
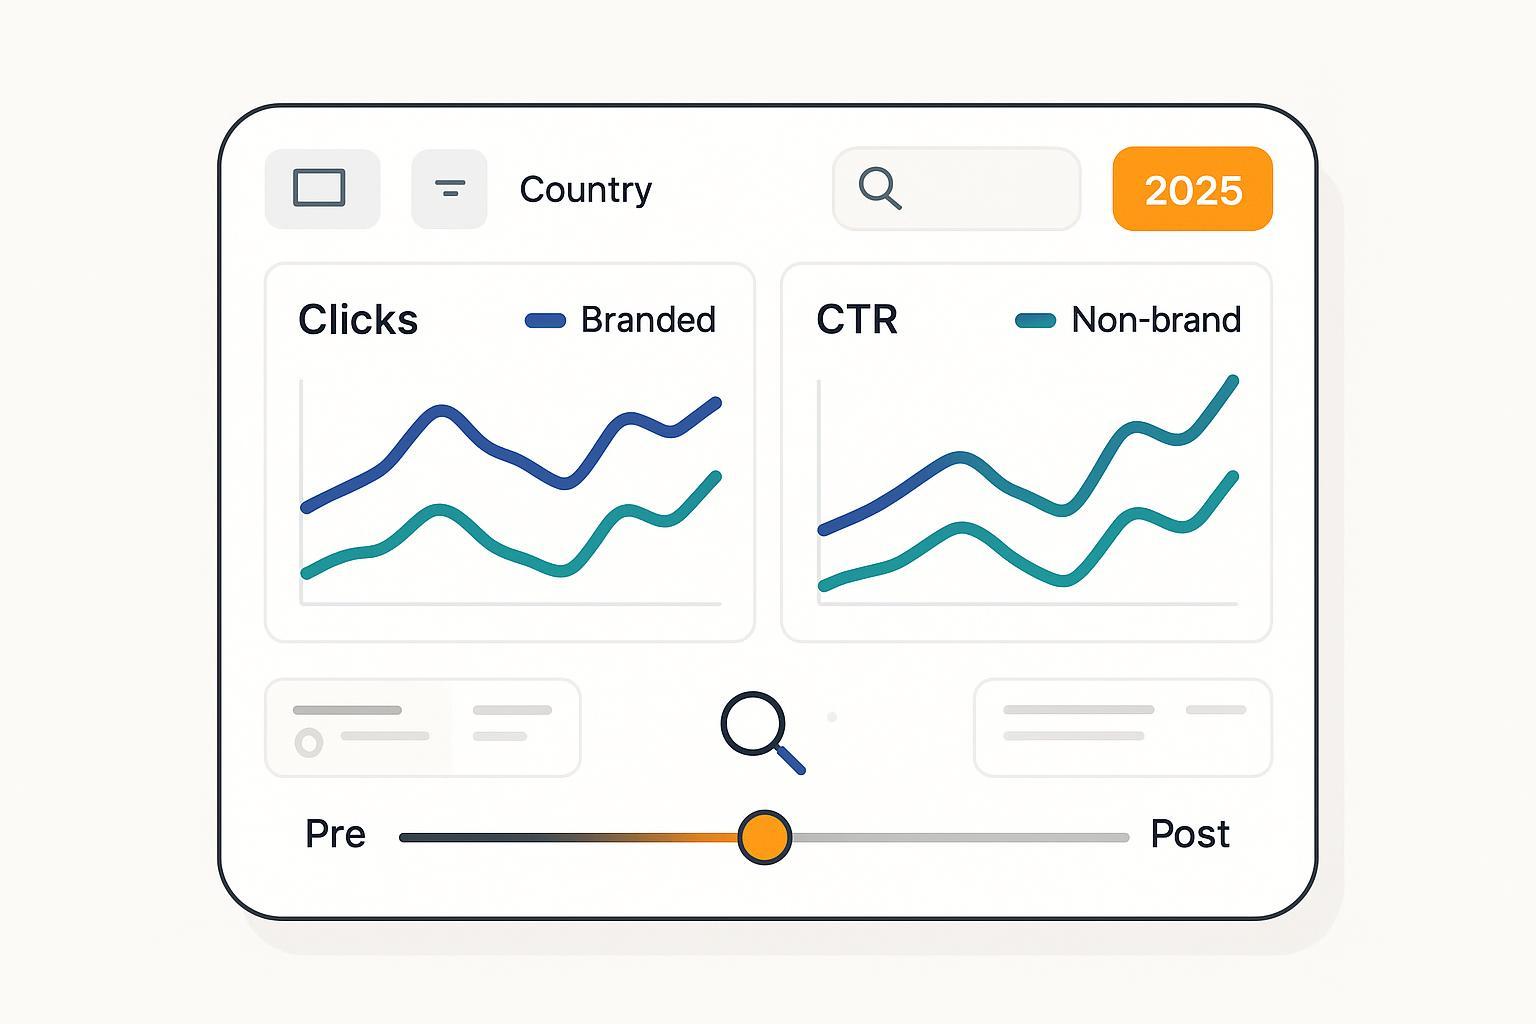
Step 9: Build a reproducible Looker Studio dashboard
Goal: Create a monitoring view stakeholders can use without exports.
Do this:
- Add data sources: native GSC and GA4 connectors; authenticate and select the correct property/stream. See Looker Studio data sources overview (help, 2025).
- Create tabs: Overview, Branded, Non-brand, Countries, Devices, Conversions.
- Create controls: date range, country, device, segment (Branded/Non-brand), and a pre/post toggle.
- Key visuals: time series for clicks and CTR by segment; a bar chart for country/device splits; tables with landing pages and GA4 engagement.
- Add annotations for rollout dates and major algorithm changes (link to your changelog referencing the Search documentation updates page (Google, 2025)).
Note: Looker Studio has field/table limits and connector-specific behaviors; design lean charts and avoid overstuffing dimensions. For general limits, see Looker Studio table limits (help, 2025).
Step 10: QA checklist and troubleshooting
Use this checklist before you share results:
-
Brand regex coverage
- Reviewed top brand queries and misspellings; coverage >95% and false positives <2%
- Localized tokens added for each market
-
GSC data integrity
- Pre/post windows align with market/device rollout
- Aware that UI filters exclude anonymized queries; totals reconciled with unfiltered aggregates
- No major site outages or indexing issues in windows
-
GA4 alignment
- Property time zone noted; day-level drift with GSC acknowledged
- Default channel group = Organic Search applied consistently
- Key conversions are configured and firing
-
Confounders and controls
- Core update and campaign dates annotated
- Control groups documented and justified
-
Dashboard integrity
- Filters and segments behave as expected
- Executive snapshot reflects the same numbers as your export
Troubleshooting tips:
- Big drops in branded clicks but stable GA4 brand-page engagement: suspect SERP layout effects (e.g., AI Overviews answering navigational queries) rather than demand loss.
- Non-brand clicks up, CTR down: impressions may be growing while more SERP elements compete for clicks; check “visibility gap.”
- Mismatched daily totals between GSC and GA4: confirm time zone differences and attribution models; see GA4 attribution model notes (help, 2025).
- No changes visible around your chosen date: confirm real rollout timing for your market/device using Google’s product posts (e.g., the Oct 2024 expansion update).
Step 11: Reporting your findings (stakeholder-friendly)
Keep it tight and decision-oriented:
-
Executive summary (1–2 paragraphs)
- Branded: net change in clicks/CTR and interpretation (cannibalization vs stable demand)
- Non-brand: net change and whether quality (engagement/conversions) rose or fell
- Confidence: high/medium/low with reasons (control quality, confounders, data lags)
-
Highlights by market/device
- Note where rollout timing aligns with observable changes
-
Recommendations (prioritized)
- Create/optimize content that earns links within AI Overviews (e.g., concise answers, FAQs, cited sources), consistent with Google’s guidance to focus on helpful, people-first content in AI search experiences; see Top ways to succeed in AI search experiences (Google, May 2025).
- Strengthen pages that win non-brand intent: match search tasks, add structured data, and refine UX for engagement.
- For branded terms with drops, improve navigational clarity and site links; ensure brand SERP assets are comprehensive.
Appendix A: Quick-start regex recipe
- Start from your brand root: “brand”, “brand name”, domain without TLD, product lines
- Add whitespace and hyphen variants
- Add top 10–20 misspellings from GSC
- Localize for each language/market
Sample to adapt:
(?i)\b(
  acmeco|acme\s*co|acme-co|
  acme|acmee|acm|acmes|
  widgetpro|widget\s*pro|widget-pro|
  example\.com|ex\s*ample|exmple
)\b
Appendix B: Minimal DiD worksheet
- Pick treatment (e.g., US mobile) and control (e.g., CA desktop or US long-tail terms rarely triggering AO).
- Compute pre/post deltas for clicks or CTR in each group.
- DiD = (post − pre in treatment) − (post − pre in control).
- If DiD is negative for branded and positive for non-brand, you may be seeing brand cannibalization and non-brand opportunity. Label as observational unless your controls are strong.
Appendix C: Useful references (official)
- AI features counted in Search Console Web Performance: AI features in Search (Google, 2025)
- 24-hour “Recent data” and cautions: Recent data in Search Console (Google, Dec 2024)
- Performance report metrics: Clicks, impressions, CTR, position (help, 2025)
- Filter behavior and anonymized queries: Filter search performance data (help, 2025)
- Search Analytics API: query endpoint (Google, 2025)
- Bulk Export: Announcement (Google, 2023) and Schema (help, 2025)
- Rollout posts: US launch (May 2024), Expansion (Oct 2024)
- GA4: Default channel grouping (help, 2025), Engagement metrics (help, 2025), Landing page (help, 2025), Attribution overview (help, 2025)
- Looker Studio: Data sources (help, 2025), Table limits (help, 2025)
By following these steps, you’ll produce a defensible, repeatable view of how AI Overviews are affecting your branded vs non-brand performance—and where to focus next. Stay flexible as Google evolves reporting, and keep an eye on the Search documentation updates page for changes that could affect your workflow.