
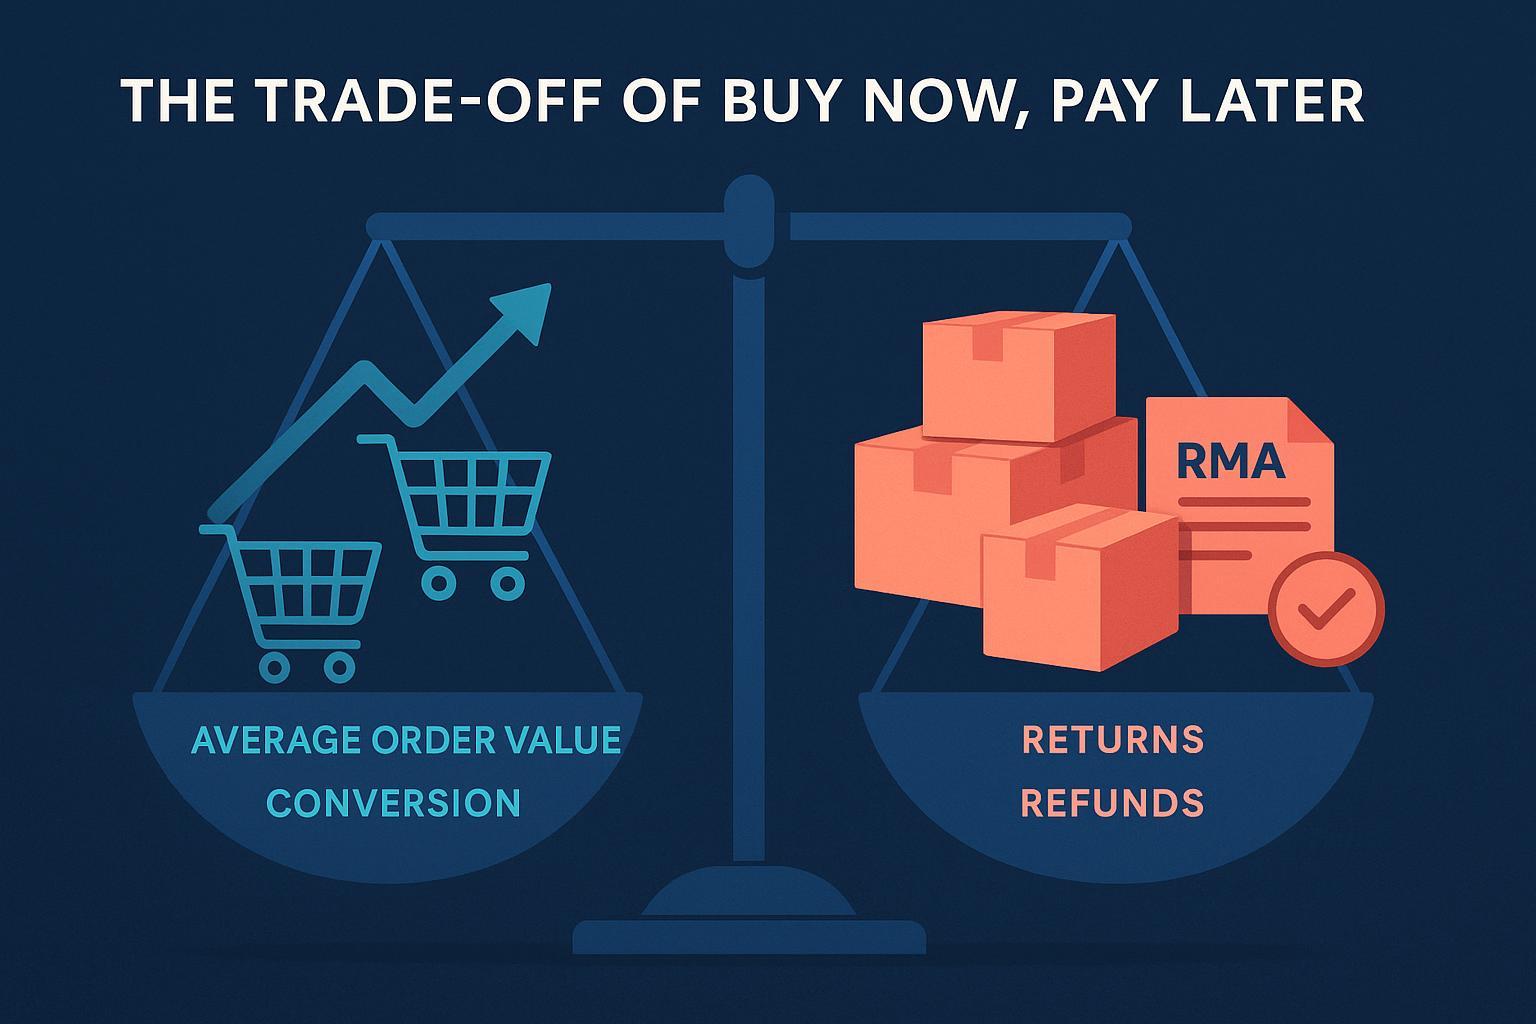
BNPL has moved from optional perk to a mainstream lever in ecommerce. In 2025, leaders are asking a sharper question: does the Average Order Value (AOV) and conversion upside justify potential downsides like higher return volume, longer refund cycles, and more disputes? Below, we synthesize the most credible, recent data and flag where evidence is thin so you can make margin-positive decisions.
What’s clear about the upside: AOV and conversion
- BNPL is now material during peak periods. Adobe’s 2024 holiday tracking shows BNPL spend set new records, with Cyber Monday alone generating around a billion dollars in BNPL purchases, according to the Adobe Cyber Monday 2024 recap. Adobe’s full-season view in January 2025 similarly underscores BNPL’s growing role in holiday ecommerce spend, per the Adobe 2024 holiday season recap (Jan 2025).
- Mobile is a major BNPL channel. Adobe forecast materials for 2024 indicated that roughly three-quarters of BNPL revenue occurred on mobile, signaling that BNPL visibility on PDPs and in mobile checkout matters for lift; see the Adobe 2024 Holiday Forecast (PDF).
- Conversion tends to improve when alternative tenders are present. Salesforce has reported that enabling modern payment options (including BNPL) can lift checkout conversion, framing “15% or more” improvements as achievable in practice when friction is reduced, as noted on the Salesforce online payment solution page. While this is not an isolated BNPL-only estimate, it matches the directional pattern many merchants see when BNPL is surfaced earlier in the journey.
Takeaway: The upside case is real—especially on mobile and during peak traffic. Exact AOV and conversion lift will vary by catalog mix, ticket size, and how early BNPL is messaged. Treat any one-size-fits-all percentage as marketing, and measure in your environment.
What’s murkier: returns, refunds, and disputes
- Baseline ecommerce return rates are high (independent of payment method). The National Retail Federation’s collaboration with Appriss Retail reported that online return rates were 17.6% in 2023 (U.S.), with overall returns representing $743B in merchandise that year; see the NRF and Appriss Retail 2023 returns press release. Appriss’s 2024 summary indicates the overall return rate declined to about 13.21%, with $103B attributed to return-related fraud/abuse and similar loss categories in 2024; see the Appriss 2024 Consumer Returns summary.
- BNPL-specific return-rate deltas are not well quantified publicly. Public benchmarks that break out return rate by tender (BNPL vs non-BNPL) remain scarce. Merchant anecdotes vary by category and by BNPL product type (e.g., Pay‑in‑4 versus longer-term financing). The strongest explanatory variable appears to be category mix—apparel/footwear can see 20–30% returns regardless of tender—plus multi‑item “try-before-you-buy” behavior.
- Refund latency and customer expectations matter. BNPL providers typically update installment schedules and process refunds after the merchant confirms receipt and approval, but exact timelines vary by provider and flow (full vs partial returns). Without standardized, citable SLAs across providers, merchants should map each provider’s refund webhooks, reconciliation behaviors, and consumer messaging to avoid unnecessary WISMO/WRMA contacts and disputes.
- Disputes and friendly fraud are rising across ecommerce. Public, BNPL‑specific dispute rates are inconsistently disclosed. Operationally, tighter identity/velocity checks and clear returns documentation help, but you should rely on your own dispute analytics by tender rather than generic benchmarks.
Takeaway: The public record does not show a consistent, quantified “BNPL increases returns” effect. Returns volume often rises when BNPL encourages larger baskets or shifts sales into high-return categories—but that’s a merchandising mix story first, payment tender second. Assume uncertainty here and measure directly by tender in your analytics.
The math that matters: contribution margin with BNPL
Think in terms of contribution margin per order, net of BNPL fees and expected returns.
- Revenue-side: baseline conversion, AOV, units per order.
- Cost-side: BNPL merchant discount rate (negotiated), fulfillment and reverse logistics cost, expected return rate, refund operations cost (support, reconciliation), dispute loss/handling.
- Cash flow: most BNPL providers pay merchants upfront, which can ease cash conversion cycles compared with in-house financing; still, fees can be higher than standard card rates.
A simple way to evaluate:
- Step 1: Establish baseline contribution margin per order for comparable traffic cohorts without BNPL.
- Step 2: Layer in observed changes with BNPL (ΔConversion, ΔAOV, ΔUnits/Order), then subtract incremental return costs tied to those extra units and categories.
- Step 3: Sensitivity-test return-rate assumptions (+/− 200–300 bps) and fee ranges to see when BNPL is margin-accretive.
Rule of thumb: If your incremental gross margin from BNPL-attributed lift (conversion × AOV × units) materially exceeds BNPL fees plus the added reverse-logistics/operational burden, BNPL is paying for itself. If not, tighten eligibility and presentation until it does.
Vertical and product scenarios: where BNPL shines (and where to be cautious)
- Apparel/footwear (high returns): BNPL can boost basket size, but returns are structurally high. Emphasize fit/size tooling, rich PDP content, and clear return windows. Consider restricting BNPL for first-time customers on the highest-return SKUs until sizing confidence is established.
- Electronics/home (moderate returns, higher tickets): Longer-term financing options can unlock big-cart purchases with lower incremental return risk than fashion. Prominently show prequalification widgets on PDPs for big-ticket items.
- Luxury/high-ticket: Financing can drive meaningful AOV lift but warrants enhanced fraud screening and explicit restocking/return policies.
- Pay‑in‑4 vs installment loans: Pay‑in‑4 tends to influence mid-ticket acceleration and multi-item baskets; longer-term financing is more about unlocking single, high-ticket conversions. Each has different fee and risk profiles—model separately.
- Seasonal peaks: During holidays, BNPL visibility earlier (PDP, cart) typically performs best. Ensure returns logistics capacity and refund communications can absorb the post-peak surge.
Implementation playbook: maximize upside, contain returns
-
Surface BNPL earlier and smarter
- Show BNPL availability and estimated per‑period price on PDPs for items above your typical threshold.
- Use targeted prompts for cart values just below free shipping or bundle thresholds.
- Match BNPL product to price band: Pay‑in‑4 for mid-ticket, financing for high-ticket.
-
Reduce return propensity at the source
- Invest in fit guidance, user-generated content with fit notes, and rich imagery/videos.
- Highlight compatibility/specs for technical products; reduce “didn’t fit/work as expected” reasons.
- For high-return SKUs, test BNPL eligibility limits for first-time buyers or for certain size/color variants with chronic return rates.
-
Tighten refund and reconciliation operations
- Implement provider webhooks so that refunds post promptly after RMA approval; reflect partial refunds correctly.
- Monitor days-to-refund and WISMO/returns contact rates by tender; set internal SLAs.
- Align emails/SMS to explain how BNPL refunds adjust installment schedules to preempt support tickets.
-
Harden risk controls
- Use identity/velocity checks and device fingerprinting for BNPL traffic spikes.
- Track disputes by tender and reason code; address “item not received” and “not as described” root causes in operations and content.
KPIs to track by tender (BNPL vs non-BNPL)
- AOV, conversion rate, units per order.
- Category mix and price-band mix.
- Return rate, RMA volume per 1,000 orders, top return reasons.
- Days-to-refund, partial vs full refund share, support contacts per order.
- Dispute rate, win rate, loss amount per order; fraud screens triggered.
- Contribution margin per order net of BNPL fees and expected return costs.
Bottom line for 2025
- Strong evidence: BNPL participation correlates with higher checkout performance during peaks and on mobile, per Adobe’s 2024/2025 reporting (Adobe Holiday Forecast 2024; Adobe Cyber Monday 2024 recap). Enabling modern tenders is directionally associated with higher conversion, per Salesforce’s online payments guidance.
- Inconclusive evidence: Public data does not robustly show that BNPL intrinsically raises return rates. Baseline ecommerce returns are high regardless of tender, per NRF/Appriss 2023 returns data and the Appriss 2024 summary. Category mix and basket composition are the primary drivers.
- Practical recommendation: Roll out BNPL where your sensitivity tests show clear contribution-margin accretion. Pair it with returns-mitigation tactics (fit tools, content, eligibility rules) and tight refund operations so AOV gains aren’t eaten by reverse logistics and support costs.
If you track these KPIs by tender and iterate eligibility and presentation, you can harness BNPL’s upside while keeping returns and refunds in check—turning a hot 2025 trend into a durable margin win.