
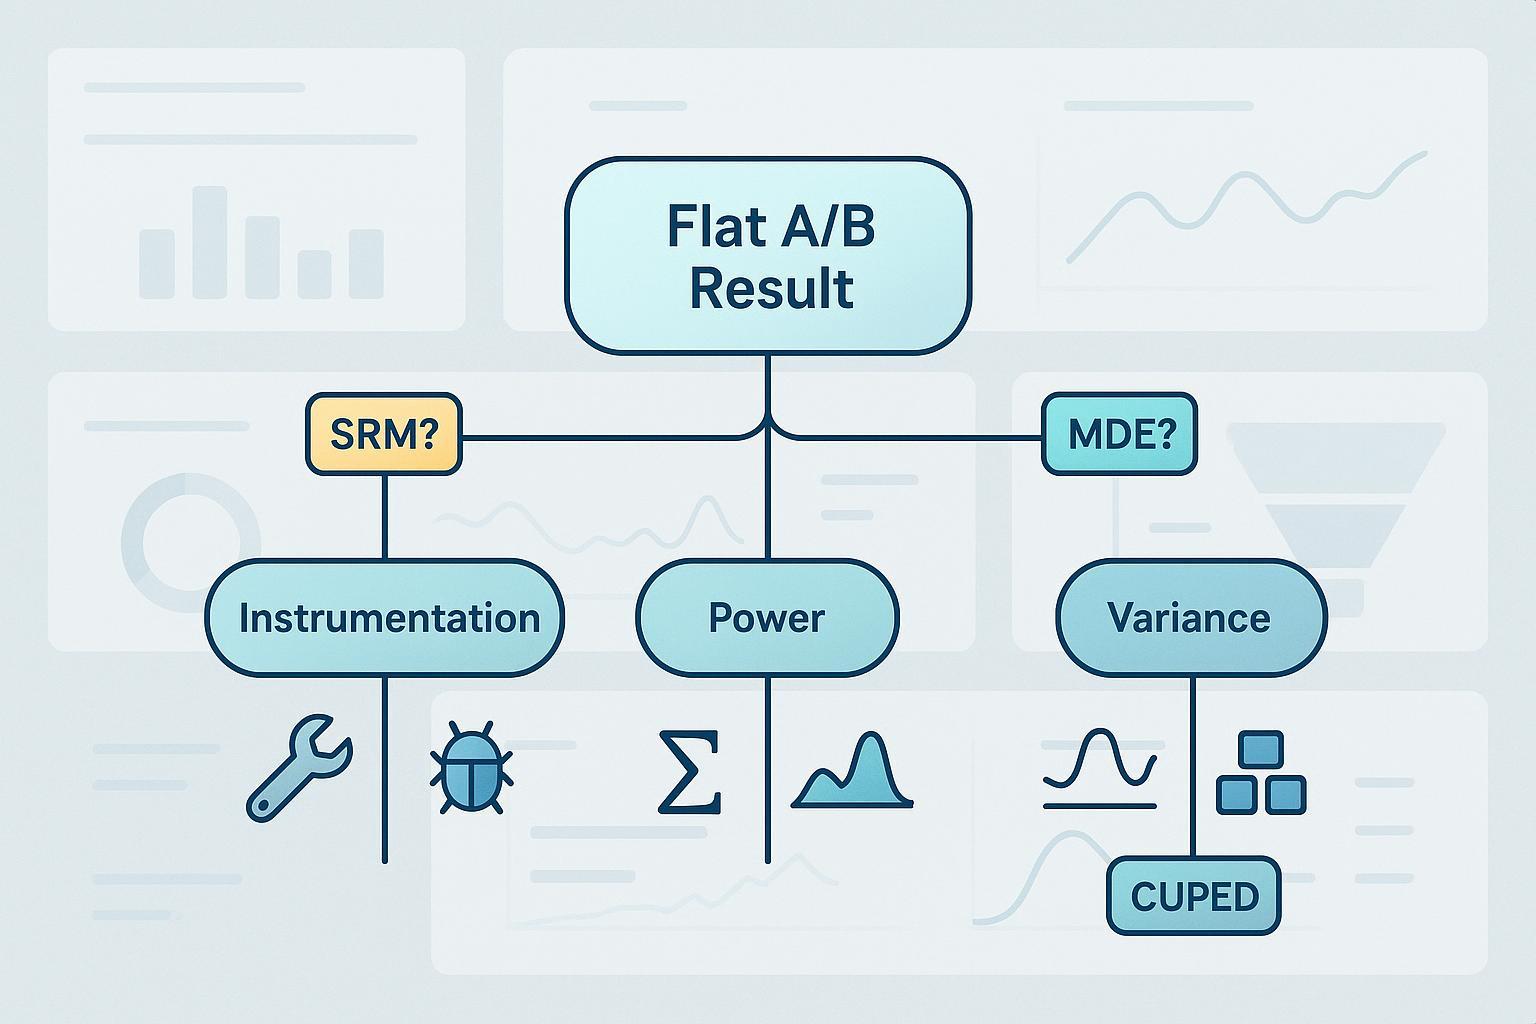
When an A/B test comes back “flat,” it’s tempting to declare “no effect” and move on. In practice, most flatlines fall into three buckets: instrumentation problems, lack of statistical power, or excess variance drowning out a real but small signal. This guide lays out a practical, 2025-ready diagnostic sequence and shows how to tell which bucket you’re in—and what to do next.
We’ll deliberately start with instrumentation, then check power (sensitivity), and only then attack variance. The order matters: you don’t want to spend cycles on power/variance if your data collection was broken.
The fast triage: start here
- Instrumentation sanity (stop-the-line checks)
- Run an SRM (Sample Ratio Mismatch) test on variant allocation; flag if p < 0.01 using a chi-square goodness-of-fit test. This threshold is widely used in modern platforms, including the automatic SRM monitors described by Optimizely’s automatic SRM detection (2023–2024) and Statsig’s SRM articles (2024–2025).
- Scan event health: missing or duplicated events, schema changes, funnel step parity, one-sided noncompliance (treatment not applied consistently). Optimizely’s support notes common causes and health indicators in “Good experiment health” (2024) and “Possible causes for traffic imbalances” (2024).
- Look for bot/invalid traffic spikes by source/ASN; concentrated bots can trigger SRM or distort conversion rates. Cloudflare’s official docs explain bot scoring and mechanisms like the __cf_bm cookie in “Cloudflare cookies” (2025) and the “Bot score” overview (2025).
- Sensitivity (power) sanity
- Compute your Minimum Detectable Effect (MDE) from baseline rate, alpha, power, and allocation. If your plausible effect size is below MDE, you’re underpowered—no surprise the result looks flat. For formulas and calculators, see Evan Miller’s sample size derivations.
- Avoid naive “peeking.” If you need interim looks, use a sequential framework (alpha-spending or anytime-valid methods) as discussed in Spotify Engineering’s sequential testing series (2023–2024) and Booking.com’s group sequential approach (2023).
- Variance diagnosis
- Inspect metric volatility and user-mix shifts. Consider variance reduction with CUPED and stratification. The theoretical underpinnings and practical gains from CUPED are summarized in “A New Look at CUPED” on arXiv (2023) and practitioner explainers like Statsig’s CUPED guide (2024) and Matteo Courthoud’s derivation (2024). For stratification basics, see Statsig’s post on stratified sampling (2025).
Comparison at a glance: the three buckets
| Bucket | Typical symptoms | Quick checks | What confirms it | Fastest fixes | Time-to-fix |
|---|---|---|---|---|---|
| Instrumentation | Traffic splits drift, sudden metric jumps/drops, inconsistent funnel step counts, weird device/region skews | SRM chi-square (p<0.01), event loss/duplication scans, exposure→trigger→conversion parity, bot score segments | Root cause found in assignment, SDK, logging, or bot filters | Pause and fix logging/assignment, re-run A/A, re-launch | Hours → days |
| Power (sensitivity) | Stable pipelines, but CIs wide; expected lift is tiny; many metrics with multiplicity penalties | Baseline + α, power → compute MDE; check allocation ratio and tails (one- vs two-sided) | Plausible effect < MDE under current design | Increase N/duration, rebalance allocation, pre-specify primary metric, consider one-sided (if justified) | Days → weeks |
| Variance | High day-to-day swings, segment effects, seasonality; flat overall but pockets move | Pre-period variance review; user-mix/traffic shifts; heteroskedasticity diagnostics | Variance reduction (CUPED/stratification) materially tightens CIs; results stabilize | Add CUPED covariates, stratify/block, cluster-robust SEs, choose more sensitive leading metrics | Days → weeks |
Note: We order the buckets by diagnostic sequence, not by importance.
1) Instrumentation first: SRM, event health, and bots
SRM in one line: it’s a statistically significant mismatch between expected and observed variant allocations—evidence that randomization or exposure logging deviated from plan. Modern platforms commonly alert when a chi-square test yields p < 0.01. This is reflected in Optimizely’s automatic SRM detection (2023–2024) and Statsig’s guidance on SRM diagnostics (2024–2025).
Practical SRM steps
- Confirm intended allocation (e.g., 50/50) and compute expected counts by arm. Run the chi-square test; if p < 0.01, treat as SRM.
- Segment SRM by device, browser, region, referrer, and traffic source to localize the issue.
- Inspect assignment code and SDK versions. Ensure exposure fires once per user and sticks; check crash logs for asymmetry.
- Review mid-test configuration changes (splits, eligibility filters) and caching/redirect paths that can bias exposure.
- Check bot/invalid traffic. Cloudflare documents scoring and JS challenges; sudden surges from certain ASNs or headless browsers can skew allocation and depress conversions. See Cloudflare’s bot score overview (2025) and its reference architecture for bot management (2025).
- If a root cause is found, pause, fix, and re-run—ideally validating with an A/A test to confirm false-positive rates and event health. Platform support articles like Optimizely’s “Good experiment health” (2024) outline routine checks.
Common root causes to keep on your shortlist
- Assignment/eligibility bugs; exposure not always triggering; event schema drift; duplicate logging; bot and crawler traffic; unbalanced rollouts or split changes mid-test. For a causes overview, see Optimizely’s traffic imbalance notes (2024) and Eppo’s SRM primer (2025).
When to stop and relaunch
- Any SRM flag you can’t explain quickly.
- Major event loss or duplication discovered post-launch.
- One-sided noncompliance (treatment not reliably delivered) that invalidates intent-to-treat interpretation.
2) Sensitivity and power: is your MDE realistic?
A flat result with wide intervals often means the test couldn’t detect the effect size you care about. Compute MDE given your baseline, alpha, desired power, and allocation. If your expected lift is smaller than MDE, consider it a design problem—not a product null.
Core formulas (binary outcome)
Per-group sample size for absolute lift d with baseline p:

n ≈ 2 · (Z_{1−α/2} + Z_{1−β})^2 · p(1−p) / d^2
For continuous outcomes, replace p(1−p) with σ^2 (variance). These approximations and derivations are explained in Evan Miller’s sample size write-up.
Worked example (binary)
- Baseline conversion p = 0.10
- Target absolute lift d = 0.02
- Two-sided α = 0.05 → Z_{1−α/2} ≈ 1.96
- Power 1−β = 0.80 → Z_{1−β} ≈ 0.84
- Then n ≈ 2 × (1.96 + 0.84)^2 × 0.10×0.90 / 0.02^2 ≈ 1,915 per group
Allocation and tails
- Unequal allocation increases total N for the same MDE. If you must allocate more to treatment (e.g., 33/67), account for the variance inflation.
- One-sided tests reduce required N but should be pre-registered and used only with strong directional priors. Many platforms default to two-sided testing; confirm your settings in documentation like Optimizely’s Stats Engine glossary.
Multiple comparisons and sequential looks
- If you monitor many metrics or segments, control error rates via FWER (e.g., Bonferroni) or FDR (Benjamini–Hochberg). Platform-specific implementations vary.
- Naive peeking inflates false positives. If interim looks are operationally necessary, adopt a group sequential design or anytime-valid approach as detailed in Spotify Engineering’s framework discussion (2023) and Booking.com’s GST notes (2023). Spotify’s public Confidence docs on sequential tests (2024) also outline practical setups.
Practical power playbook
- Increase N/duration or traffic allocation to treatment.
- Pre-specify a single primary metric; demote secondary metrics or control via FDR.
- Consider more sensitive leading indicators that are causally linked to your north-star metric—then verify the linkage in follow-up tests.
- If you have a strong directional hypothesis and credible priors, a one-sided test can be appropriate—pre-register to avoid hindsight bias.
3) Variance: when noise buries signal
Even with perfect instrumentation and sufficient N, high variance can mask a genuine but small effect.
Where it comes from
- Seasonality and time trends (day-of-week effects, promotions, holidays)
- User-mix and traffic-source shifts (paid bursts, geography changes)
- Heteroskedasticity and clustering (repeat visitors, session-level correlation)
- Interference/spillovers (SUTVA violations in social/marketplace contexts)
CUPED: pre-period covariates to the rescue
- CUPED constructs a variance-reduced outcome using a pre-treatment covariate X.
θ = Cov(Y, X) / Var(X)
Y_cv = Y − θ · (X − E[X])
Var(Ŷ_cv) = Var(Ŷ) · (1 − ρ^2), where ρ is corr(Y, X)
- Intuition: the stronger the correlation (ρ), the larger the variance reduction (proportional to ρ^2). Ensure X is pre-treatment and stable. For derivations and cautions, see arXiv’s “A New Look at CUPED” (2023), Statsig’s CUPED explainer (2024), and Matteo Courthoud’s guide (2024).
Stratification and blocking
- Randomize within strata defined by predictive pre-treatment covariates (e.g., device, geography, traffic source, pre-period behavior). This improves balance and reduces variance. A practical overview is in Statsig’s stratified sampling article (2025).
Robust inference for clustering
- Use cluster-robust standard errors when observations are not independent (e.g., multiple sessions per user, or clusters by campaign/source). This prevents underestimating uncertainty when there is intra-cluster correlation.
Pitfalls to avoid
- CUPED hurt cases: weak correlation, leakage from post-treatment signals, or non-stationarity that breaks the pre/post relationship.
- Over-fragmenting strata: too many small cells increases variance and complicates analysis.
- Ignoring interference: when users influence each other across arms, consider cluster-level randomization or exposure mappings.
Scenario playbook: what to do next
-
Scenario A: High traffic, stable pipelines, flat overall
- Likely variance/metric sensitivity. Add CUPED with strong pre-period covariates; stratify by key predictors; switch to a more sensitive leading metric that’s causally linked to your north-star; run longer across cycles to smooth seasonality.
-
Scenario B: Low traffic, tiny expected lift
- Likely power bottleneck. Increase sample size or extend duration; consider one-sided testing (if justified and pre-registered); pre-specify a single primary metric; raise MDE targets or stack experiments to reach adequate signal.
-
Scenario C: SRM alert or event health anomalies
- Instrumentation issue. Pause, triage SRM by dimension, inspect assignment/SDK/exposure triggers, check bot/ASN clusters, fix and re-run. Validate with an A/A test before resuming.
-
Scenario D: Flat overall, pockets of movement in specific segments
- Heterogeneity. Pre-specify segments using theory/business logic; stratify randomization or use post-stratification with multiplicity control; avoid p-hacking by limiting segment peeks or using FDR.
Communicating a flatline to stakeholders
- Frame the counterfactual: “Given our baseline and power, we would only reliably detect lifts above X%; our observed effect is within a Y% interval.”
- Separate product truth from design limits: “This looks flat because our MDE was 2.5%; if the true effect is 1%, the test is not sensitive enough.”
- Share a plan: “We’ll (a) validate instrumentation via A/A, (b) relaunch with CUPED and stratification, and (c) extend duration to reach an MDE aligned with the expected lift.”
- Avoid overclaiming: A null hypothesis test doesn’t prove “no effect.” It indicates insufficient evidence to reject the null under this design.
Appendix: equations and snippets you can copy
SRM (chi-square goodness-of-fit)
χ^2 = Σ_i (O_i − E_i)^2 / E_i,  df = k − 1
Flag SRM if p < 0.01 in practice; investigate by dimension.
MDE / sample size (binary)
n_per_group ≈ 2 · (Z_{1−α/2} + Z_{1−β})^2 · p(1−p) / d^2
CUPED variance reduction
θ = Cov(Y, X) / Var(X)
Y_cv = Y − θ · (X − E[X])
Var(Ŷ_cv) = Var(Ŷ) · (1 − ρ^2)
Multiple comparisons (FDR example)
Benjamini–Hochberg: sort p-values p_(1) ≤ … ≤ p_(m)
Find largest k with p_(k) ≤ (k/m)·α, declare p_(1…k) significant.
Sequential testing pointers
- Group sequential (Pocock, O’Brien–Fleming) or anytime-valid mSPRT/e-values; see Spotify Engineering’s overview (2023) and Spotify Confidence docs (2024).
References and further reading (2023–2025)
- SRM and experiment health: Optimizely automatic SRM detection (2023–2024); Optimizely Support: Good experiment health (2024); Statsig SRM diagnostics (2024–2025); Eppo SRM explainer (2025); VWO SRM glossary (2023).
- Power and sequential testing: Evan Miller’s sample size math (ongoing); Spotify Engineering on sequential frameworks (2023); Booking.com GST article (2023); Spotify Confidence docs (2024); Optimizely Stats Engine glossary.
- Variance reduction: arXiv “A New Look at CUPED” (2023); Statsig CUPED explainer (2024); Matteo Courthoud on CUPED (2024); Statsig on stratified sampling (2025).
- Bot/invalid traffic: Cloudflare cookie reference (2025); Cloudflare bot score concepts (2025); Cloudflare reference architecture for bot management (2025).
FAQ
-
“Our A/A test showed a significant difference—now what?”
- Treat it as an instrumentation problem. Audit assignment, exposures, and event pipelines; run SRM by dimension; check for bots. Fix and re-run A/A until false-positive rates align with expectations.
-
“Should I switch to a Bayesian approach to avoid peeking issues?”
- Bayesian methods can offer different decision semantics, but you still need principled stopping rules and to avoid “optional stopping” pathologies. If you need frequent looks, consider anytime-valid frequentist methods or pre-defined Bayesian decision thresholds.
-
“Can CUPED replace longer test duration?”
- CUPED can materially reduce variance when the pre-period covariate is strongly correlated with the outcome. It doesn’t create signal from nothing; you may still need more data if the expected lift is tiny relative to noise.
-
“Why do my secondary metrics disagree with the primary?”
- Multiplicity and noise. Pre-specify one primary metric, control the rest via FDR, and prefer theoretically linked secondary metrics to avoid forking paths.