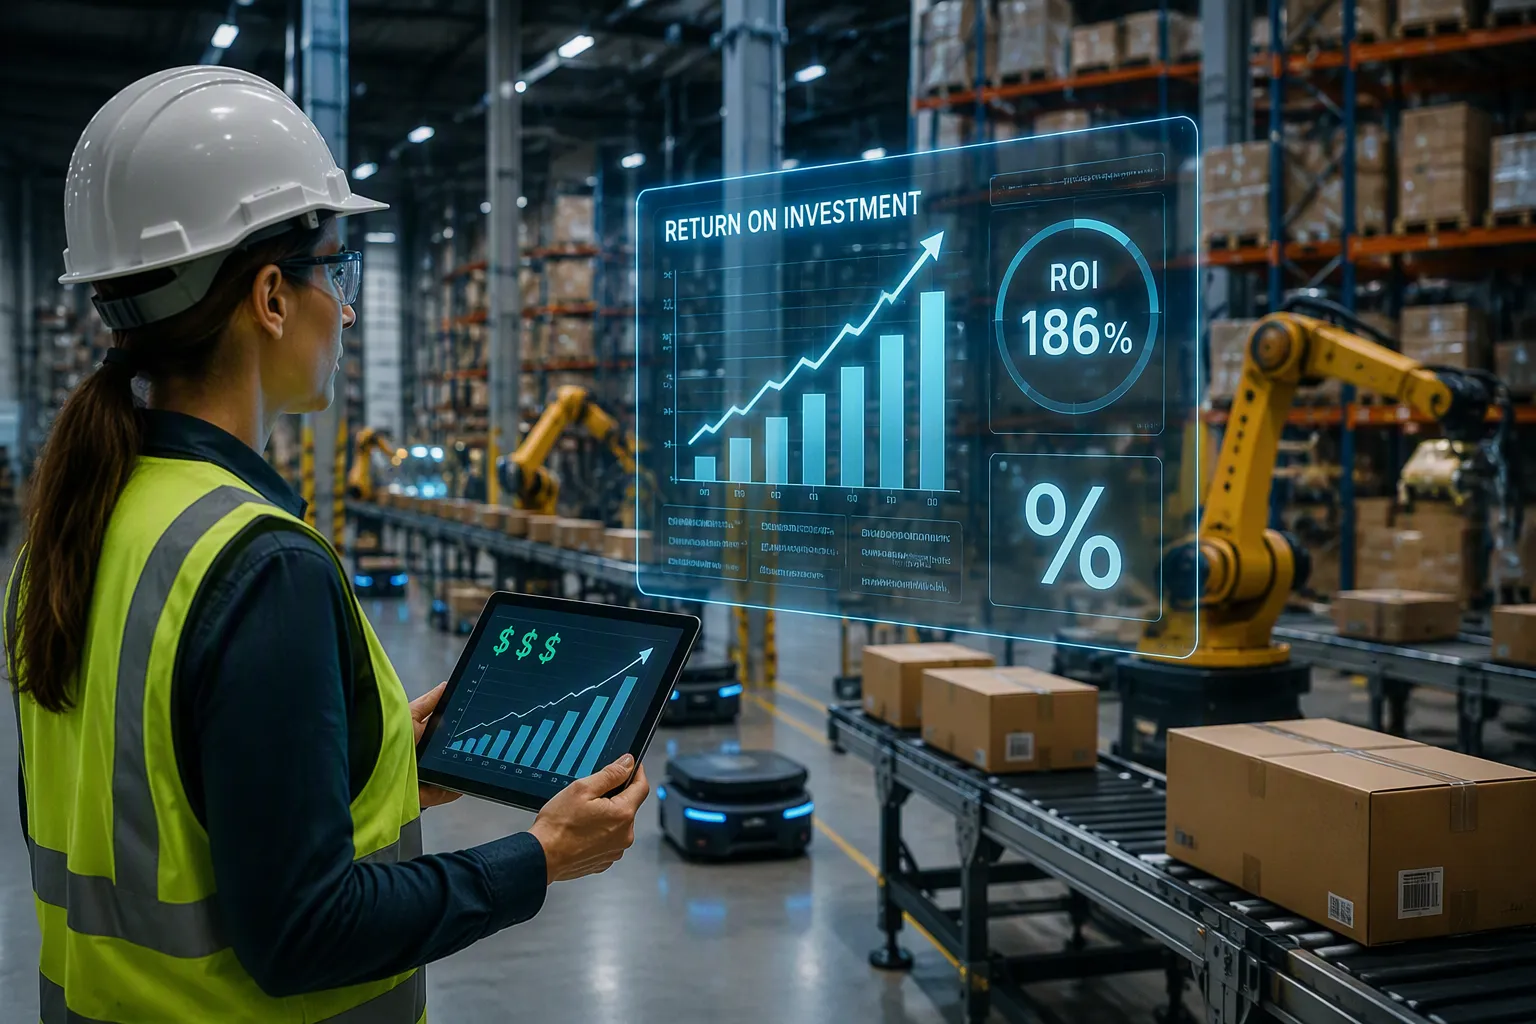
ROI = (Total Savings − Total Costs) ÷ Total Costs × 100. This simple formula anchors every warehouse automation decision. The math stays straightforward once teams identify each variable. Warehouse Automation ROI is not just labor replacement. It includes throughput, accuracy, space, and safety gains.
Warehouse automation ROI is not a payback claim. It's a measurable operating performance decision. The most defensible ROI models begin with a comprehensive supply chain analysis that establishes a clean baseline.
This guide walks readers through every cost, every saving, and a real calculation example. No advanced finance degree is needed. Readers will also find payback period analysis, intangible benefits, and common pitfalls to avoid. Warehouse automation rewards careful planning.
Warehouse Automation ROI Formula
The Basic ROI Equation
Total Costs vs. Total Savings
The warehouse automation ROI formula is simple: ROI (%) = [(Total Benefits − Total Costs) / Total Costs] × 100. Total costs include equipment, software, integration, maintenance, and training. Total savings cover labor reduction, throughput gains, error reduction, space savings, and injury reduction. Hidden costs can push projects 20% over budget in the first year. A board-ready method models the full three-year total cost of ownership and favors systems that start modestly and scale over time.
Why Percentage Alone Is Not Enough
A single ROI percentage can mislead. A project with a high five-year ROI may still strain cash flow if payback stretches past three years. Pair the percentage with payback period and internal rate of return for a CFO-ready analysis. Payback Period (years) = Total Investment Cost / Annual Net Savings. This pairing shows both the size and the speed of the return.
Four Variables That Drive ROI
Labor Cost Savings
Labor is often the largest warehouse expense, sometimes reaching 65% of total operating costs. Labor cost savings vary by automation type:
| Automation Type | Labor Cost Reduction (Year 1) |
|---|---|
| Robotic Arms | 40–60% |
| Pick-to-Light | 30–50% |
| AMRs | 30–40% |
| AS/RS | 25–35% |
| Conveyor | 20–30% |
Source: McKinsey, LogisticsIQ, 2025
Throughput Gains
Automation lifts picks per hour by 2–5x. Faster cycle times also cut transportation costs and lower inventory carrying costs. These downstream gains rarely appear in vendor templates, yet they strengthen the roi of warehouse automation.
Error Reduction and Space Use
Most warehouse automation conversations start with labor savings. That focus is understandable, as labor is often the largest cost in an operation, sometimes reaching 65% of total warehouse expenses. But focusing solely on labor is a mistake... It overlooks what may be a larger opportunity: accuracy.
Error reduction cuts returns processing by 60–80%. AS/RS delivers 40–60% more storage in the same footprint. Injury reduction lowers workers' comp claims by 20–30%. These gains compound across the operation.
Why ROI Matters for Decisions
Comparing Automation to Manual Operations
A 200,000-sq-ft DC processing 8,000 orders/day typically sees payback in 2.5–3.5 years with a 5-year ROI of 180–250% (McKinsey). Manual operations cannot match that trajectory without proportional hiring. Warehouse automation systems shift the cost curve instead of adding headcount.
Justifying Capital Expenditure
Executives approve capital when the numbers hold up. A mid-size DC deploying autonomous forklifts invested $300,000 in hardware, infrastructure, integration, and training. Annual labor savings reached $256,000. Annual ongoing costs were $22,500. Net annual savings hit $260,500. Payback came in at 1.15 years, roughly 14 months. Five-year benefits totaled $1,302,500 against $412,500 in costs, producing a 215.8% ROI. That is the kind of case that wins approval.
Automation roi depends on four variables: labor cost savings, throughput gains, error reduction, and space utilization. Track all four. Then pair cost, throughput, and payback with IRR. That combination gives decision-makers a complete picture of warehouse automation solutions before any purchase order is signed.
Warehouse Automation Cost Components
Ask ten vendors how much does warehouse automation cost, and ten different answers come back. Every answer starts with "it depends." That variation makes accurate cost estimation one of the hardest parts of any ROI calculation. A structured warehouse automation buyer's guide framework helps buyers compare quotes on equal terms.
Upfront Capital Costs
Equipment and Hardware
Hardware covers robots, conveyors, sortation systems, scanners, and racking. Buyers often overestimate this line and underestimate everything else.
Software and Integration
Software, integration, and ongoing operations together make up the majority of the five-year spend. Adapting standard WMS platforms to unique inbound and outbound logic requires uncapped development hours. Mismatches between WMS, WES, WCS, and RCS layers can delay project acceptance and force manual coordinate remapping.
Facility Modifications
Rework of column spacing, floor flatness tolerances, and fire suppression systems often follows the final automation layout. Uneven floors can delay robots. Reinforcing floor slabs for heavy pallet shuttles and upgrading power infrastructure for charging stations add further expense.
Ongoing Operational Costs
Maintenance and Spare Parts
Recurring maintenance covers scheduled servicing, inspections, and cleaning. Batteries, sensors, belts, and grippers wear out, so critical spares must stay on-site to avoid downtime. Service Level Agreements define response and repair commitments.
Software Updates and Support
Ongoing software updates, support, and licensing fees form a permanent line item. Adding robots can increase WMS, fleet-management, and control-system license costs.
Energy and Utilities
Charging stations, conveyors, and climate-controlled zones draw continuous power. A medium facility may need access-point upgrades because racking creates wireless dead zones.
| Year | Ongoing Ops Cost |
|---|---|
| Year 1 | $18K |
| Year 2 | $46K |
| Year 3 | $58K |
| Year 4 | $64K |
| Year 5 | $70K |
| 5-Year Total | $256K |
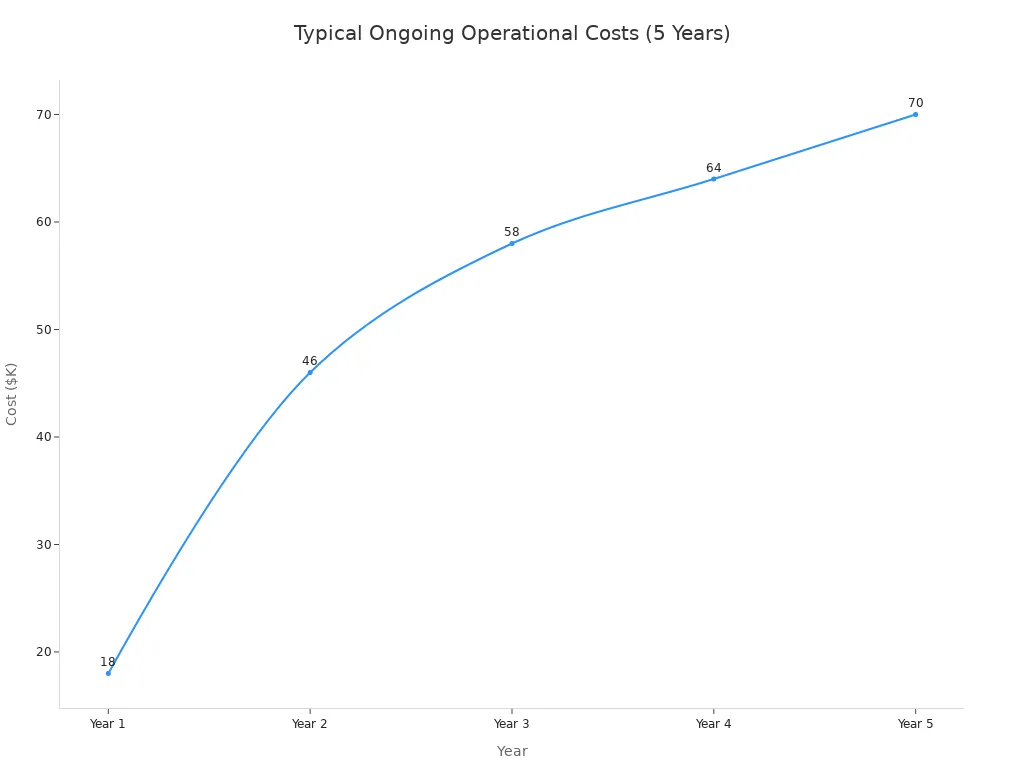
Ongoing operations account for approximately 23% of the total five-year cost of ownership ($1.11M).
Indirect and Hidden Costs
Training and Change Management
Retraining operators on a new WMS platform takes time and money. IT, operations, and finance teams may spend months supporting the project, an opportunity cost that belongs in the budget.
Downtime During Ramp-Up
Parallel cutover means running old and new processes simultaneously for 2–8 weeks, which can temporarily double operating costs. Peak-season go-live adds temporary workers and overtime on top of the project budget.
Vendor and Project Management
Change orders escalate when deferred items land on the project team after installation begins. A complete investment cost breakdown captures these items. Failure to update total cost of ownership models as operations change leaves outdated assumptions in place. A disciplined total cost of ownership analysis and investment cost analysis keep the warehouse automation cost picture honest. These warehouse automation costs decide whether automated warehouse systems ever pay back. Buyers who follow a warehouse automation buyer's guide avoid the worst surprises.
Savings and Revenue Gains
Labor Savings
Reduced Headcount and Overtime
Labor remains the single largest expense in most warehouses, often reaching 65% of total operating costs. Automation directly attacks this line. Operations typically cut labor needs by 30–40% and reduce labor costs by up to 40%. Overtime reduction alone often saves $100K–$500K per year at mid-scale facilities. These labor cost savings form the foundation of most business cases.
Lower Recruitment and Training
High turnover plagues warehouse operations. Every replacement hire costs $3,000–$8,000 to recruit and train. Automation reduces headcount volatility and stabilizes the workforce. Fewer hires mean fewer training cycles and lower administrative burden. This saving compounds quietly over time and strengthens the overall case that warehouse automation pays off for your business.
Throughput and Accuracy Gains
Higher Picks per Hour
Automated picking solutions process orders up to three times faster than manual methods. Goods-to-person systems maintain accuracy rates above 99%. Automated systems run 24/7 and cut pick times by up to 50%. These throughput gains translate directly into revenue capacity without adding staff. The operation ships more orders per shift and captures demand that manual processes cannot handle.
Fewer Errors and Rework
Error reduction delivers some of the most overlooked returns. Automated systems lower error rates to under 0.1%. Mis-picks cost $25–$50 each to correct. For a facility processing 5,000 orders daily, error and return savings reach $200K–$1.2M per year. Fewer errors also reduce returns processing and improve customer satisfaction. This category ties directly to the error reduction variable in any ROI model.
Space, Safety, and Strategic Savings
Increased Storage Density
Automated storage systems need less aisle space and use vertical height more effectively. Pallet shuttle AS/RS units store and retrieve items in tall racks without extra floor space. This density gain often eliminates the need for leased overflow space. Industrial lease rates run $8–$14 per square foot annually in most U.S. markets. Space savings feed directly into the space and labor roi equation.
Lower Injury Rates
Automation removes workers from dangerous tasks like high-level picking and repetitive heavy lifting. Injury rates drop by 25–40% in typical deployments. Lower claims mean reduced workers' compensation premiums and less lost time. Safety improvements also boost morale and retention.
Scalability Without Proportional Hiring
Peak season no longer demands a hiring surge. Automated warehouse systems scale output without adding headcount. This flexibility improves margins during high-volume periods. The operation absorbs growth without repeating the same recruitment and training cycle. Data visibility from integrated WMS platforms further sharpens decision-making. Together, these gains show how warehouse automation pays off across multiple dimensions, not just labor. A model focused only on labor cost savings typically understates true ROI by 30–50%. Space savings and data intelligence deserve equal attention in any warehouse labor costs analysis.
Step-by-Step ROI Calculation
Scenario Setup
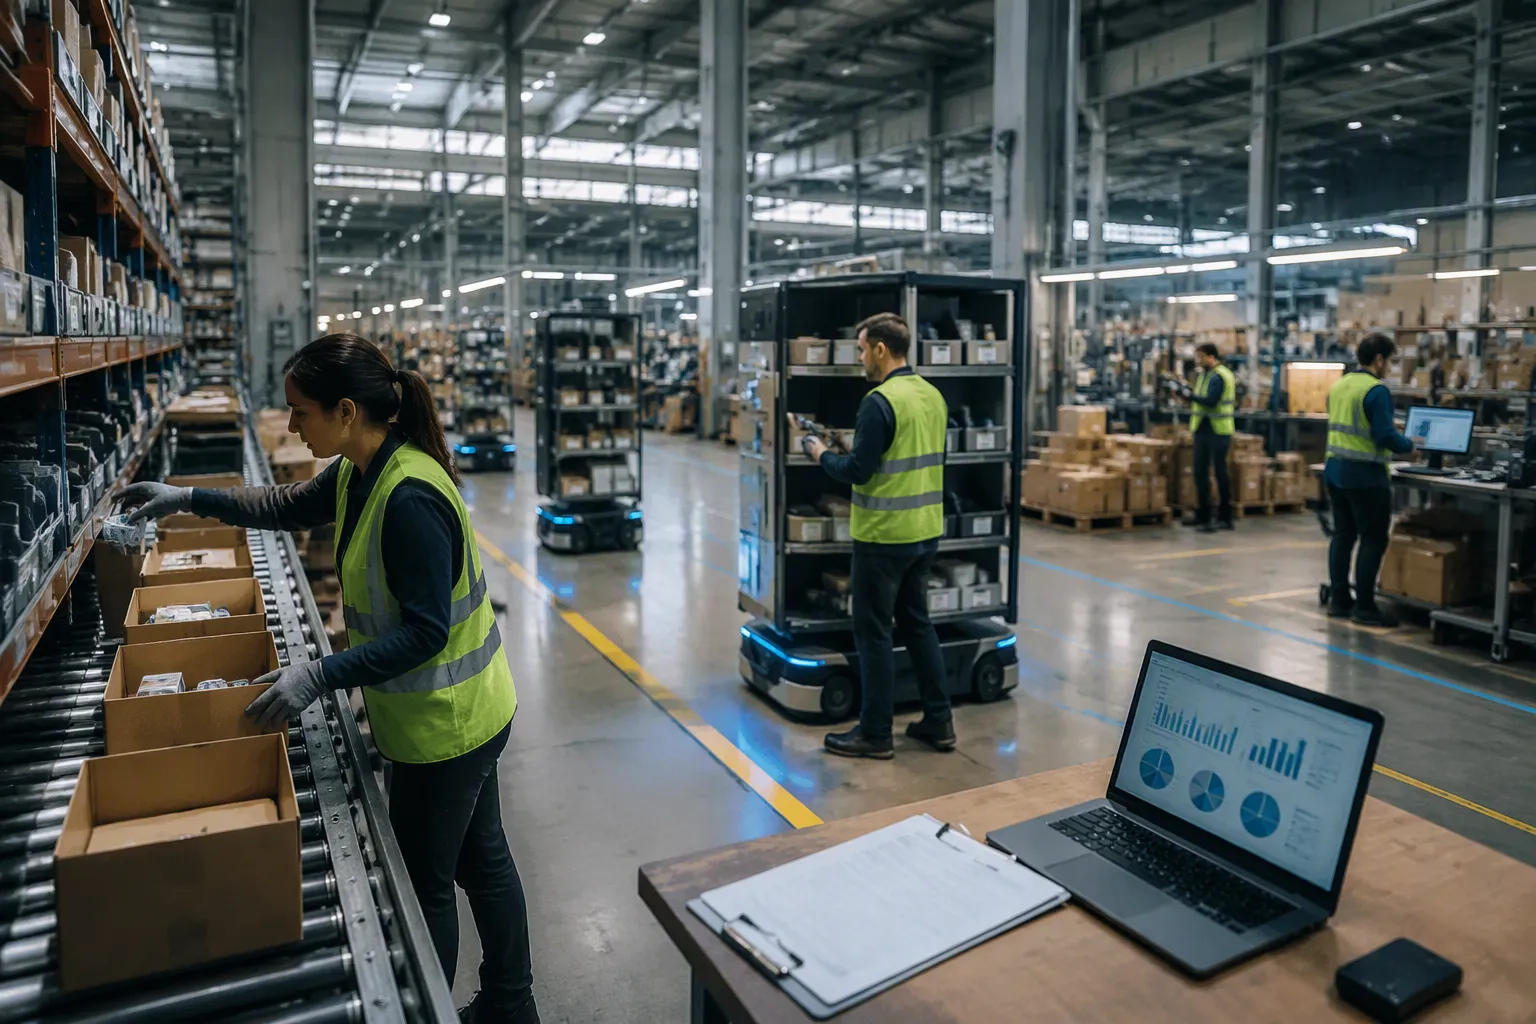
A concrete example clarifies the warehouse automation roi process. Consider a mid-size distribution center processing 8,000 orders daily through manual picking. The facility processes goods through receiving, quality control, inventory counts, picking, and shipping. Labor absorbs 65% of the operating budget. Error rates run near 2 percent, and overtime adds 15 percent above base wages during peak periods. The facility leases 20,000 square feet of overflow storage to handle inventory surges.
Baseline Warehouse Profile
The operation employs 120 pickers at an average loaded cost of $45,000 per year. Annual labor spending totals $5,400,000. Returns processing from picking errors costs $800,000 each year. Workers' compensation premiums add $150,000. Overflow space costs $200,000 annually. Every warehouse automation investment competes against this current-state cost structure. This baseline anchors any warehouse automation decision.
Automation Solution Assumptions
The warehouse automation systems proposed include autonomous mobile robots with goods-to-person picking stations. Total investment cost reaches $8,640,000. This figure covers equipment, software integration, facility modifications, training, project management, and ongoing operational costs. The system targets a 40 percent reduction in direct labor, a 60 percent drop in error-related returns, and a 30 percent gain in picks per hour. These assumptions come from vendor site surveys and support a strong automation roi case.
Total Costs Over Five Years
Year-by-Year Cost Breakdown
The $8,640,000 investment lands unevenly across five years. Year one carries the heaviest burden as the organization purchases equipment, modifies the facility, and runs parallel operations during cutover. Years two through five carry only recurring expenses such as maintenance contracts, software licensing fees, energy consumption, and spare parts inventory. The weighted average cost of capital of 8 percent discounts future costs to present value. Conducting scenario analysis over at least five years ensures the baseline scenario accurately forecasts manpower and space needs without automation.
Summing Upfront and Ongoing Costs
Total costs over five years equal $8,640,000. This number includes approximately 65 percent in capital expenditure and 35 percent in operational expenditure. Establishing a cost baseline by analyzing the facility's operational accounts and mapping cost allocations to productivity metrics prevents surprises. The analysis uses this total as the denominator to calculate the roi for the full evaluation period. Proper cost classification enables accurate calculating roi and payback later.
Total Savings Over Five Years
Annual Labor and Throughput Savings
Labor reduction delivers the largest savings stream. The system cuts 48 picking positions, saving €2,160,000 per year. Overtime elimination saves another €320,000 annually. Throughput gains allow 15 percent annual order growth without adding staff, saving €600,000 in avoided hiring and training each year. Total annual labor and throughput benefits equal €3,080,000.
Error Reduction and Safety Savings
Error reduction contributes the second major benefit category. The system cuts mis-pick rates from 2 percent to 0.1 percent, reducing returns processing by 60 percent and saving €480,000 per year. Workers' compensation claims drop by 25 percent, saving €37,500 annually. Space savings eliminate the €200,000 overflow lease. Total annual savings from these categories reach €717,500. Real roi calculations must include these often-overlooked benefits. Annual savings across all categories total €4,700,000.
Final ROI and Payback Period
The numbers produce clear answers. Year one ROI equals -41 percent because the full $8,640,000 investment lands before savings accumulate. Payback period equals $8,640,000 divided by €4,700,000, or 1.7 years. The investment pays back in under two years and then generates profit. Five-year total benefits reach €23,500,000 against costs of $8,640,000, producing a total ROI of 193.75 percent. The internal rate of return reaches 34 percent, well above the 8 percent hurdle rate. Net present value totals €8,300,000. Calculating roi and payback together shows both the speed and size of the return. Sound roi modeling pairs the percentage return with the payback timeline. These metrics give finance teams everything needed to approve the warehouse automation roi case.
Payback Period and the ROI of Warehouse Automation
What Payback Period Means
Simple vs. Discounted Payback
Simple payback divides total investment by annual net savings. It ignores the time value of money. Discounted payback applies a discount rate to each year's cash flow before accumulating returns. A project with an 8 percent weighted average cost of capital will show a longer discounted payback than a simple one. Both measures matter. Simple payback answers how fast cash returns. Discounted payback answers whether the return beats the cost of capital.
Calculating Payback from ROI Data
The formula is straightforward: payback period equals total investment cost divided by annual net savings. A warehouse automation project costing $8,640,000 with annual savings of €4,700,000 pays back in 1.7 years. Teams can pull these figures directly from their ROI model. The same data that produces a five-year ROI percentage also produces the payback timeline. No separate analysis is needed.
What Counts as a Good Payback
The 12–24 Month Benchmark
A strong warehouse automation roi typically delivers payback in 12 to 24 months. Projects that exceed 36 months strain cash flow and face tougher executive scrutiny. The benchmark varies by facility size, labor market, and automation type. Mid-size distribution centers often land in the 2.5 to 3.5 year range for complex systems. Simpler deployments such as autonomous forklifts can pay back in roughly 14 months.
Factors That Shorten or Lengthen Payback
Higher labor costs accelerate payback. Facilities in tight labor markets see faster returns because automation replaces expensive overtime and turnover. Larger upfront investments lengthen payback. Facility modifications, integration complexity, and parallel cutover periods all add cost before savings begin. Error rates also matter. A facility with a 2 percent mis-pick rate captures larger accuracy savings than one already running at 0.5 percent.
Interpreting Payback with ROI
Why Fast Payback Is Not Always Best
A short payback period does not guarantee the best investment. A cheap system may pay back quickly but lack scalability. It may solve today's problem without addressing tomorrow's growth. Decision-makers should ask whether the system supports future volume increases. A slightly longer payback on a scalable platform often delivers greater long-term value.
Balancing Payback and Long-Term Value
Payback periods and ROI percentages work together. The payback shows speed. The ROI percentage shows size. A project with a 34 percent internal rate of return and a 1.7-year payback tells a complete story. One metric alone can mislead. Executives who read both make better capital decisions. The automation roi case becomes stronger when speed and magnitude align.
Intangible Benefits and Risks
Soft Benefits
Employee Morale and Retention
Automation removes workers from repetitive, physically demanding tasks. This shift improves working conditions and reduces turnover. Lower turnover makes recruitment easier and keeps experienced teams intact. A stable workforce produces more consistent output. These gains rarely appear on a spreadsheet, yet they strengthen the business case for warehouse automation.
Hard metrics support this point. Companies track workers' compensation costs, turnover rates, recruitment expenses, and absenteeism. They also link employee satisfaction surveys to productivity metrics. A reduction in lost-time incidents becomes a direct financial benefit.
Customer Satisfaction and Brand
Faster order fulfillment and higher accuracy improve the customer experience. Fewer mis-picks mean fewer returns and fewer complaints. A reliable delivery record builds brand trust over time. These outcomes support improved customer service, stronger competitive advantage, and greater operational resilience.
Data Visibility and Decision-Making
Integrated systems generate real-time data on inventory, labor, and throughput. Managers use this information to spot bottlenecks and adjust schedules. Better decisions reduce waste and improve service levels. This intelligence compounds across the operation and supports long-term planning.
Risks That Erode ROI
Technology Obsolescence
Automation hardware and software evolve quickly. A system that meets today's needs may fall behind in three years. Repeated prototype changes inflate development costs. Buyers should evaluate vendor roadmaps and upgrade paths before committing.
Integration Challenges
Connecting automation to existing WMS and ERP systems often costs 15–20% of the total project budget. Underestimating this work leads to change orders and delays. Navigation or control problems discovered late require costly rework. Safety redesigns after deployment add further expense.
Overestimated Savings, Underestimated Costs
Optimistic projections erode returns. Under-tested systems cause downtime and reduce throughput. Vendor instability creates long-term cost traps through proprietary software and exclusive contracts. Multi-vendor compatibility saves 15–25% on expansions. These risks quietly shrink the warehouse automation ROI.
Quantifying Intangibles
Conservative Dollar Values
Teams should assign conservative dollar values to soft benefits. They can use hard metrics like workers' compensation costs and turnover rates as anchors. If two projects have similar financial ROI, the one with stronger overall business value wins. Every improvement deserves a quantification attempt.
Sensitivity Analysis
Sensitivity analysis tests how ROI changes when assumptions shift. Teams adjust labor savings, error rates, and integration costs across a range. This practice reveals which variables matter most. It also prepares decision-makers for uncertainty and builds confidence in the final recommendation.
Tips to Maximize Automation ROI
Start Small and Scale
Pilot Projects and Phased Rollouts
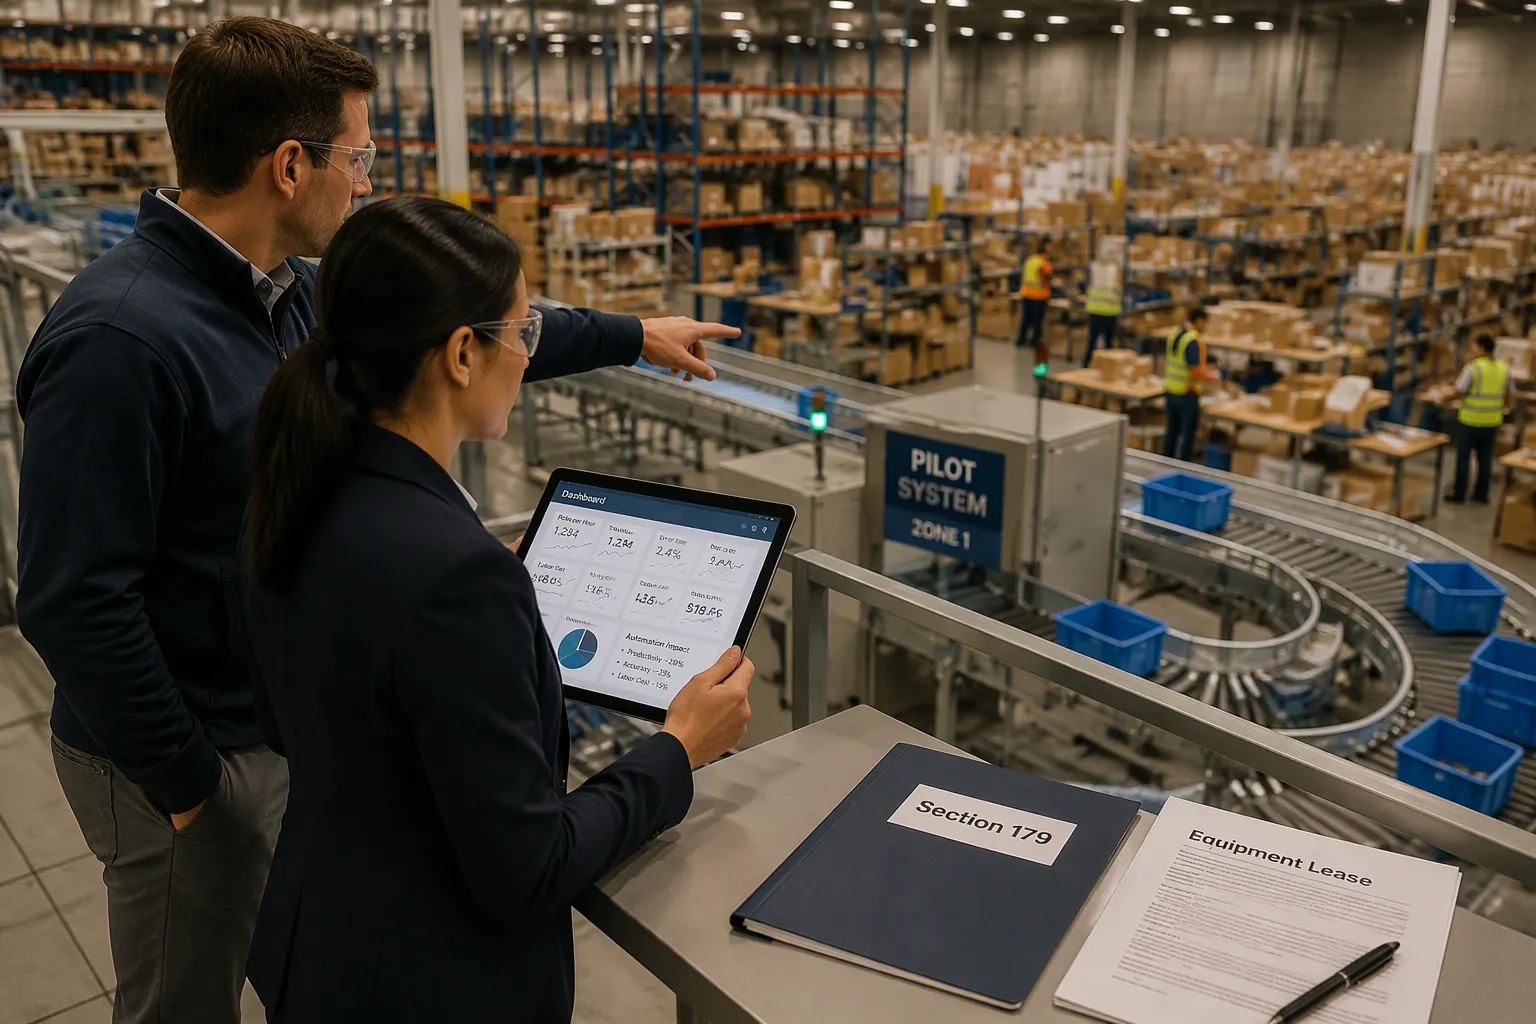
A phased approach minimizes disruption and allows adjustments based on early experiences. Operations implement modular components that scale over time. This method spreads the investment across multiple budget cycles. A pilot project in one zone tests the technology before full commitment. Effective planning means building the whole solution and paying the entire capital do not happen on day one. Common starting points include conveyors and sortation systems for high-volume lines, AS/RS and shuttle systems for dense storage, or AMRs and AGVs for flexible goods movement.
Measuring Results Before Full Commitment
Baseline metrics must exist before automation arrives. Teams measure picks per hour, error rates, and labor costs in the current state. After the pilot, they compare results against these numbers. Adjustments follow before expanding to additional zones. This measured approach protects capital and builds confidence. Each phase validates assumptions and refines the next step. Floor champions help speed adoption during ramp-up. Hands-on training before go-live reduces productivity loss.
Explore Financing and Incentives
Leasing, RaaS, and Equipment Financing
Not every operation needs to buy warehouse automation systems outright. Equipment loans cover up to 100 percent of the purchase price with terms of 36 to 84 months. Equipment leasing preserves balance sheet flexibility. Operating leases treat payments as operating expenses. FMV leases keep monthly costs lower with upgrade optionality. These options make the right warehouse automation system accessible without draining working capital.
Tax Credits and Government Grants
Section 179 allows full deduction of equipment purchase price in the year of installation. A $400,000 autonomous forklift could be fully deducted in year one. State-level economic development grants in states like Ohio, Texas, Michigan, and Pennsylvania explicitly cite automation and robotics. The Manufacturing Extension Partnership offers cost-share grants and subsidized consulting. These programs reduce the effective investment cost and accelerate payback.
Avoid Common Mistakes
Forgetting Ongoing and Hidden Costs
Hardware represents less than one-third of the five-year spend. Software, integration, and ongoing operations together make up roughly two-thirds of the total. Teams that focus only on equipment cost underestimate the true investment. Maintenance contracts, software licensing, spare parts, and energy consumption all add recurring expense. A complete total cost of ownership model captures every category.
Ignoring Soft Savings and Risks
Labor reduction drives most ROI calculations, but soft savings matter too. Improved safety lowers workers' compensation claims. Higher accuracy reduces returns processing. Better employee retention cuts recruitment costs. On the risk side, integration challenges can cost 15 to 20 percent of the total project budget. Overestimated savings quietly erode returns. A warehouse automation buyer's guide framework helps teams evaluate both opportunities and threats. Evaluating warehouse automation systems compared to manual operations requires realistic baselines.
Using Unrealistic Assumptions
Optimistic projections produce disappointing results. Savings must reflect actual operating conditions, not vendor promises. Disciplined execution makes the difference between success and failure. A structured warehouse automation buyer's guide ensures apples-to-apples comparisons when evaluating vendors. Teams should test assumptions through sensitivity analysis. Adjust labor savings, error rates, and integration costs across a range of scenarios. This practice reveals which warehouse automation solutions deliver under realistic conditions. A thorough buyer's guide examining automated warehouse systems prevents overconfidence.
The ROI formula—savings minus costs divided by costs—anchors every automation decision. Three variable groups drive the calculation: total costs across five years, total savings from labor and accuracy gains, and payback period. Accurate results demand both hard numbers like equipment expense and soft numbers like turnover reduction. A realistic timeline matters equally.
The 12-to-24-month payback benchmark offers a practical reference point. Projects exceeding three years face tougher scrutiny. A pilot or phased approach validates assumptions before large commitments. Operations can start with one zone and expand with confidence.
The next step is clear: calculate the numbers, evaluate vendors, and take the first step toward warehouse automation.
FAQ
What is the formula for warehouse automation ROI?
ROI equals total savings minus total costs, divided by total costs, multiplied by 100. The completed example produced a five-year ROI of 193.75 percent. Teams should pair this percentage with payback period and internal rate of return for a complete financial picture.
How long does payback usually take?
A strong warehouse automation ROI typically delivers payback in 12 to 24 months. Complex mid-size deployments often land in the 2.5 to 3.5 year range. Simpler systems, such as autonomous forklifts, can pay back in roughly 14 months.
Which costs do buyers underestimate most?
Software, integration, and ongoing operations make up roughly 65 percent of five-year spend. Integration work alone often consumes 15 to 20 percent of the project budget. Training, downtime, and spare parts add further hidden expense.
How much can labor costs drop?
Operations typically cut labor needs by 30 to 40 percent and reduce labor costs by up to 40 percent. Labor often reaches 65 percent of total warehouse expenses.
What savings come from better accuracy?
Automated systems lower error rates to under 0.1 percent. Mis-picks cost $25 to $50 each to correct. A facility processing 5,000 orders daily can save $200K to $1.2M per year through error and return reduction.
What is a good internal rate of return?
The worked example produced a 34 percent internal rate of return, well above the 8 percent hurdle rate. Net present value reached €8,300,000. Finance teams compare IRR against the weighted average cost of capital before approving capital expenditure.
How does a pilot reduce risk?
A pilot in one zone tests technology before full commitment. Teams measure picks per hour, error rates, and labor costs against a baseline. Adjustments follow before expansion. This phased method spreads investment across budget cycles and validates assumptions.
Are there tax incentives for automation?
Section 179 allows full deduction of equipment purchase price in the year of installation. State-level grants in Ohio, Texas, Michigan, and Pennsylvania cite automation and robotics. The Manufacturing Extension Partnership offers cost-share grants and subsidized consulting.
See Also
Boosting Performance Through Intelligent Online Retail Storage Tactics
The Impact Of Adaptive Slotting On Facility Workflows
Cutting-Edge Tools Revolutionizing Storage Output For The Coming Year
Key Recommendations For Smooth Stock Movement In Distribution Centers
Gaining Productivity Gains Via Pick To Cart Technology This Year