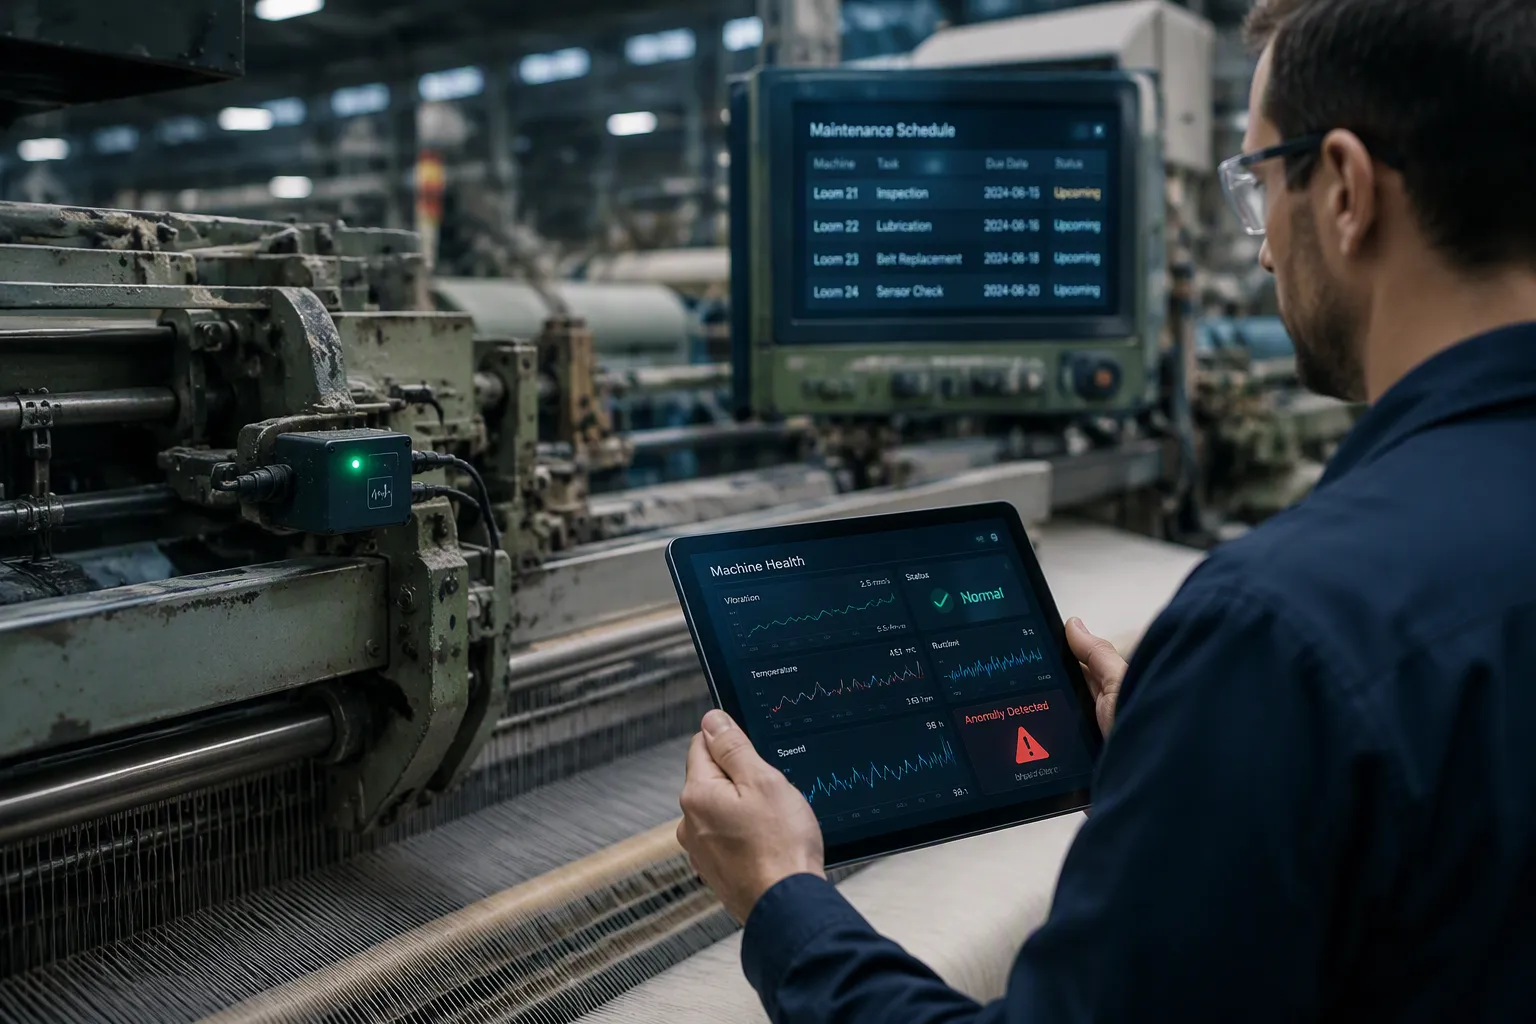
Unplanned downtime costs general manufacturing an average of $260,000 per hour, according to Aberdeen Research. This burden erodes profitability, disrupts production schedules, and frustrates plant teams. A single equipment failure can halt an entire production line for days. Predictive care offers a data-driven alternative. It shifts maintenance from firefighting to forecasting. Sensors and analytics quickly flag early warning signs before machines fail. Plant leaders can then schedule repairs during planned stops. They can adopt proven tactics, achieve real-world results, and track key metrics. These steps help teams implement predictive maintenance successfully. They make reducing unplanned downtime a practical, achievable goal, not a distant hope.
The High Cost of Unplanned Downtime
Planned vs. Unplanned: A Critical Distinction
A planned stop costs far less than an unexpected failure. During planned maintenance, teams control the schedule, stage spare parts, and complete repairs without disrupting customer orders. Unplanned downtime works in the opposite way. It strikes without warning, idles workers, and forces rushed decisions.
The financial gap is substantial. A plant that loses production worth $50,000 per hour absorbs $400,000 during a single eight-hour stoppage, according to downtime cost calculations. That figure excludes idle labor, overtime for recovery, and restart expenses. Research from Oxmaint shows that facilities deploying all eight maintenance strategies with CMMS support achieve an average 52% reduction in unplanned downtime within 18 months. Predictive maintenance using real-time sensors and data analytics can cut downtime by up to 70%. Proactive maintenance strategies deliver a 65% reduction. A strong maintenance culture that combines preventive and predictive work can reduce downtime by up to 40%.
Hidden Costs: Quality, Overtime, and Customer Delays
The visible production loss tells only part of the story. One unexpected machine stoppage triggers a chain reaction: material wastage, overtime pressure, reduced OEE, and planning disruptions. These hidden costs affect team morale, operational stability, and customer trust.
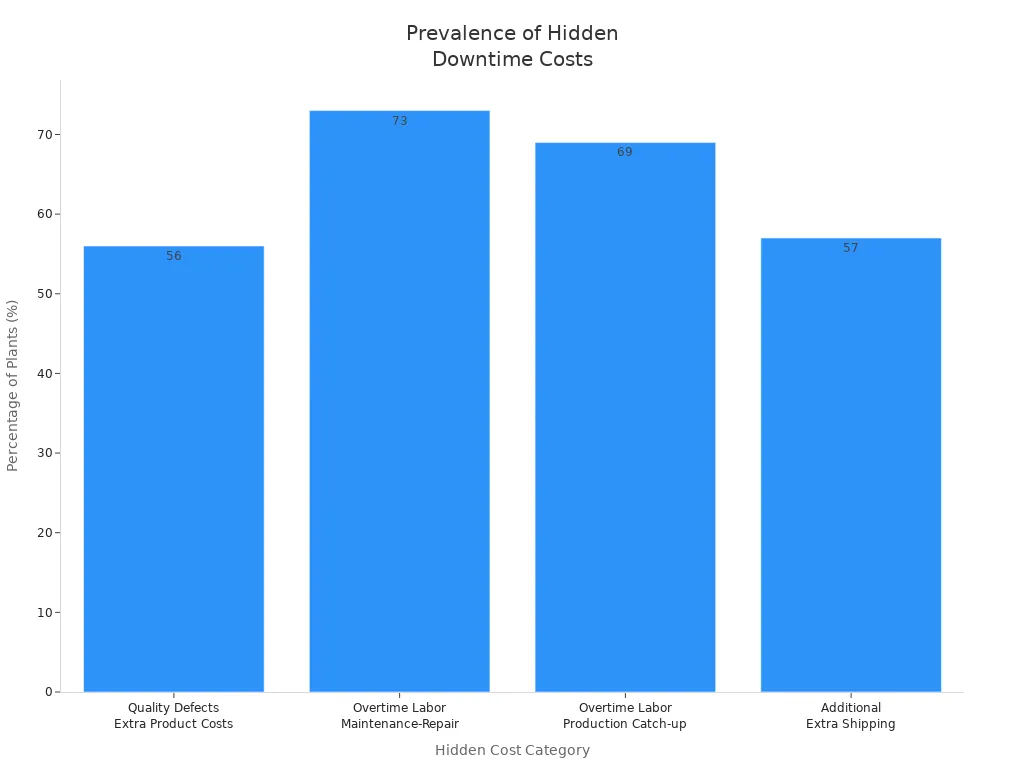
| Hidden Cost Category | Impact on the Plant |
|---|---|
| Quality Defects | Equipment produces low-quality batches that plants scrap or sell at a discount |
| Overtime Labor | Maintenance-repair and production catch-up labor can cost 1.5x as much due to overtime |
| Customer Delays | Late orders push customers toward competitors and damage long-term relationships |
| Additional Costs | Safety risks, morale decline, and extra shipping costs for replacement parts |
An OEE calculation exposes this hidden inefficiency. Availability at 90%, performance at 85%, and quality at 92% produce a real OEE of 70.4%. Machine uptime averages only 67% at process plants, and the bottom third report less than 50% uptime. These numbers show why leaders must treat every stoppage as a profitability threat.
Root Causes of Unplanned Downtime
Mechanical Failures, Electrical Faults, and Process Variability
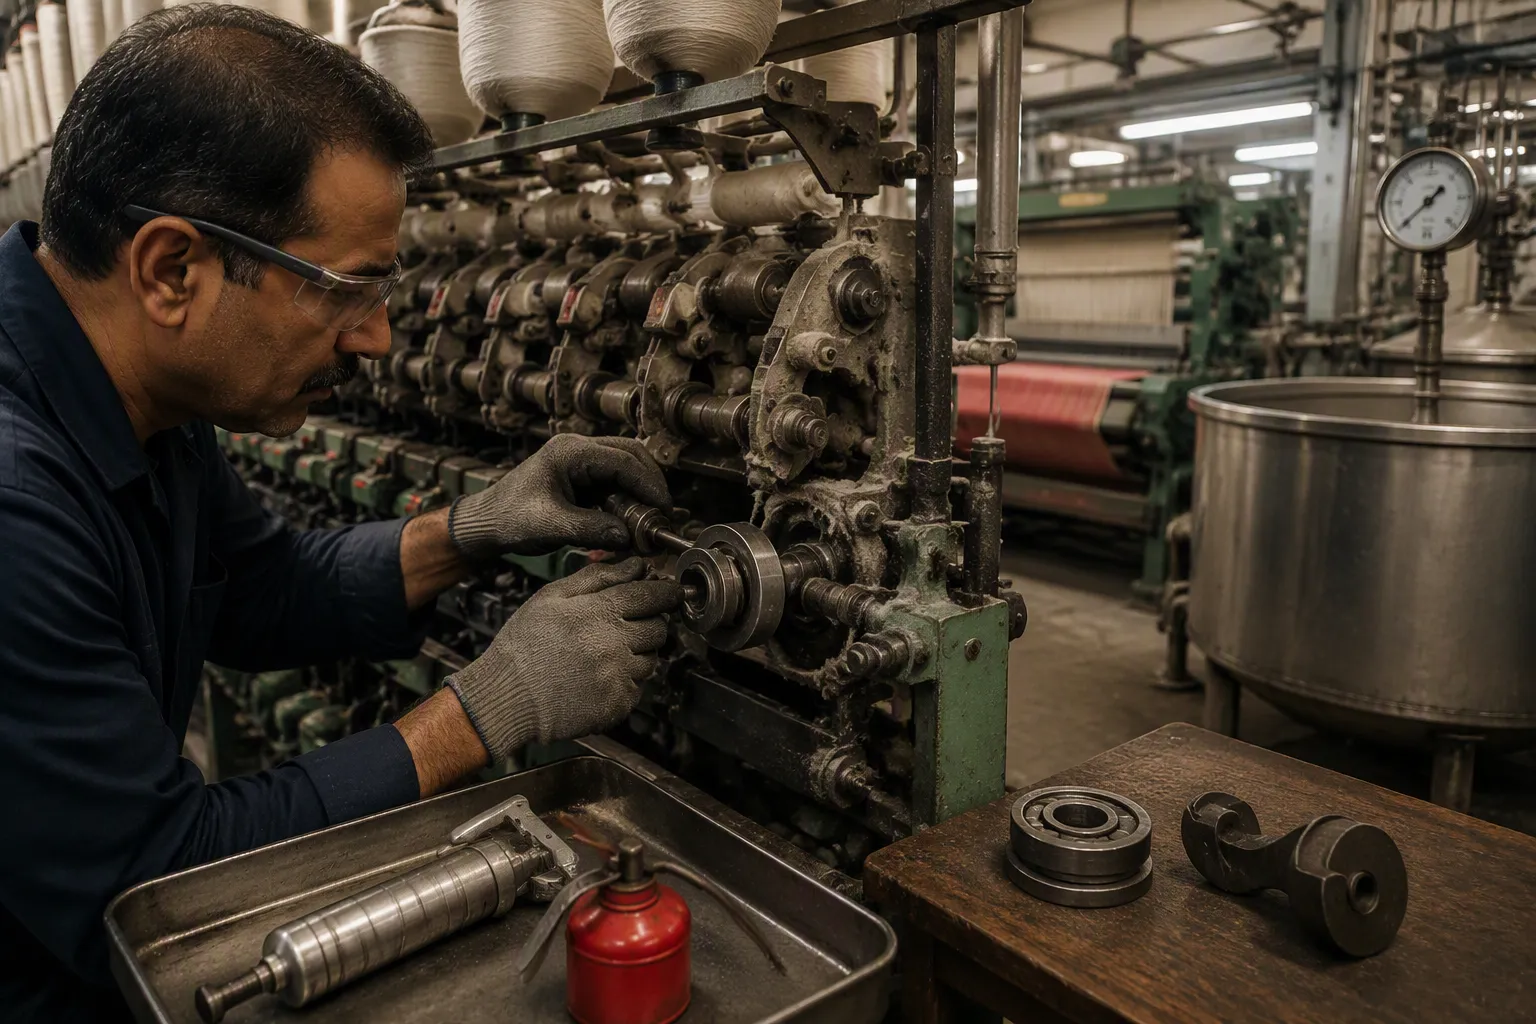
Textile machines fail for predictable reasons. Lubrication errors — wrong grade, wrong quantity, or missed points — account for 40–50% of premature bearing failures. Dust and lint accumulation in shedding mechanisms and drafting zones ranks as the second most common cause of textile machine failure. These two problems feed each other. Airborne lint bypasses weak seals, mixes with grease, and forms an abrasive paste.
Contamination and improper lubrication are the primary culprits. Airborne lint and dust easily bypass weak seals. Once inside, this debris mixes with grease to form a highly abrasive paste. Under-lubrication also causes excessive friction, leading to rapid thermal breakdown and catastrophic seizure.
Each production stage carries its own failure profile.
| Stage | Common Failure Causes | PM Focus |
|---|---|---|
| Spinning | Ring & traveller wear, spindle bearing failure, drafting-roller eccentricity, cot deterioration | Bearing checks, lubrication cycles, roller alignment, blow-room lint control |
| Weaving | Reed damage, dobby/jacquard failure from lint, crank-bearing seizure, weft-insertion faults | Loom timing, reed alignment, shedding-zone lint removal, lubrication |
| Dyeing | Temperature drift, pump-seal wear, valve-integrity loss, boiler faults | IoT-linked thermal alerts, seal/valve checks, dosing-system calibration |
| Finishing | Roller misalignment, needle & cam wear, stenter-frame drift | Cycle-count-based needle and cam inspection, roller alignment, stenter setting verification |
Mechanical faults such as shedding, beating, take-up wear, and bearing or cam issues typically account for 15%–25% of total loom downtime, and that share rises with machine age. Electrical faults — sensor faults, drive faults, control board errors, wiring issues — account for 5%–15% on well-maintained looms. One mill categorized its stops formally and found mechanical stops were only 18% of total downtime, contradicting the team's belief that breakdowns dominated. Process variability compounds the problem. Weaving defects make up 42% of defects, dyeing irregularities 28%, finishing problems 18%, and material contamination 12%. A denim mill with a 6% defect rate lost over $480,000 monthly, proving that variability disrupts output as much as a hard failure.
Organizational Gaps: Spare Parts Shortages and Slow Technician Response
Equipment problems explain only part of the story. Unplanned breakdowns consume 85 hours per month in a typical weaving facility, while reduced-speed operation adds another 75 hours. Those hours stretch further when the right spare part sits in a warehouse across town or a technician arrives hours after the alarm. A plant without a real maintenance plan defaults to unscheduled work. Teams react to failures instead of preventing them. Spare parts shortages and slow technician response turn a two-hour repair into a two-day stoppage. Both gaps trace back to planning, not machinery.
Proven Tactics for Reducing Unplanned Downtime
Shift from Reactive to Preventive Maintenance
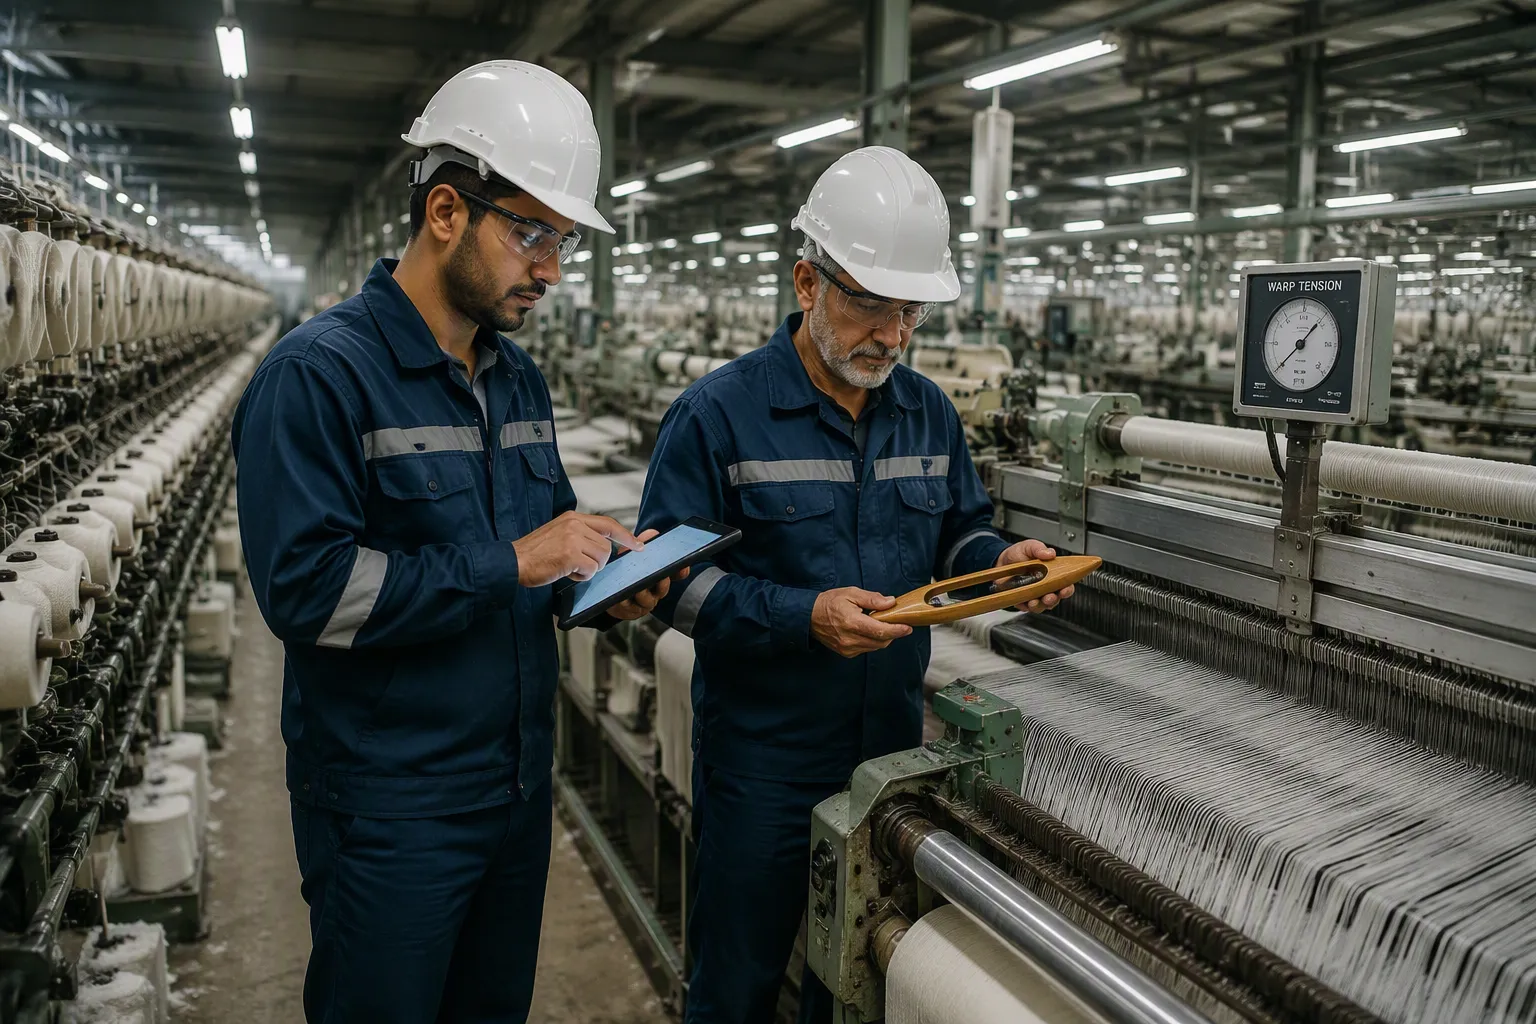
The first step toward reducing unplanned downtime involves replacing the firefighting mindset with structured preventive work. Teams build a maintenance plan from OEM manuals and organize tasks by daily, weekly, and monthly intervals. Each interval targets specific failure risks on textile equipment.
Daily shift-change inspections focus on spinning and weaving floors. Technicians check ring rail movement, traveler wear, loom shuttle condition, warp beam tension, bearing temperature, lint accumulation, emergency stop function, and compressed air pressure. Weekly inspections target the dye house and finishing areas. Teams examine stenter chain lubrication, rail alignment, steam trap systems, padder bowl pressure uniformity, chemical dosing calibration, and heat exchanger fouling. Monthly inspections address safety, fire, and dust control. Ductwork cleaning, explosion-vent inspection, sprinkler clearance, electrical panel thermography, boiler valve testing, lighting checks, and chemical storage audits form the core.
Digital deployment transforms compliance. Each asset receives its SOP with mandatory fields. Failed readings auto-trigger corrective work orders. This system shifts the checklist from documenting problems to preventing them. AI-driven analysis of inspection data assists in reducing unplanned downtime.
As production analytics mature, plants discover patterns across their fleet. A mill with 40–80 machines can implement production-level monitoring and see ROI within 60–90 days. The entry point requires no new sensor hardware. Teams track output rates, quality pass/fail rates, and downtime events per machine.
Maximizing planned shutdowns represents the next level. 80%+ of industrial turnarounds run over budget by more than 10%. Planned maintenance costs far less — unplanned downtime carries a 3–5x cost multiplier. Specialty parts require 8–12 weeks lead time. One-third of an annual budget goes to a single shutdown week. The approach follows five steps: enforce scope discipline with a freeze at week -8, map the critical path backward from restart, coordinate crew roles, flag long-lead items early, and conduct a post-shutdown review within two weeks. These schedules prevent unplanned downtime before failures occur.
Monitor Equipment with IoT Sensors and Vibration Analysis
Sensor deployment accelerates smart manufacturing and predictive maintenance. IoT sensors attach to legacy machines without modification. Vibration sensors clamp or adhesive-mount to housings. Temperature sensors surface-mount on motor casings. Current sensors clip around existing cable runs without breaking the circuit.
Each area benefits from targeted coverage. Spinning operations use vibration, temperature, and current sensors to detect bearing degradation, motor overheating, and spindle imbalance. Weaving departments deploy vibration, current, and tension sensors for reed timing drift, weft insertion failure, and drive motor degradation. Dyeing machines rely on temperature, pressure, and flow sensors for temperature deviation, pump seal failure, and valve blockage. Knitting machines use vibration, current, and yarn tension sensors for needle wear and cam degradation. Finishing lines depend on temperature, air pressure, and motor current sensors for chain rail misalignment and heating element failure. Sensor deployment targets the root causes of unplanned downtime in textile operations.
Vibration analysis delivers the highest prediction confidence. Bearing wear generates high-frequency impacts in the 2,000–5,000 Hz range, providing 48–72 hours of lead time before seizure. Imbalance produces once-per-revolution peaks at spindle RPM, offering 24–48 hours of warning. Misalignment shows elevated 2X and 3X harmonics, giving 36–60 hours of notice. Resonance displays sub-harmonic vibration with broadband noise, yielding 12–36 hours of advance warning.
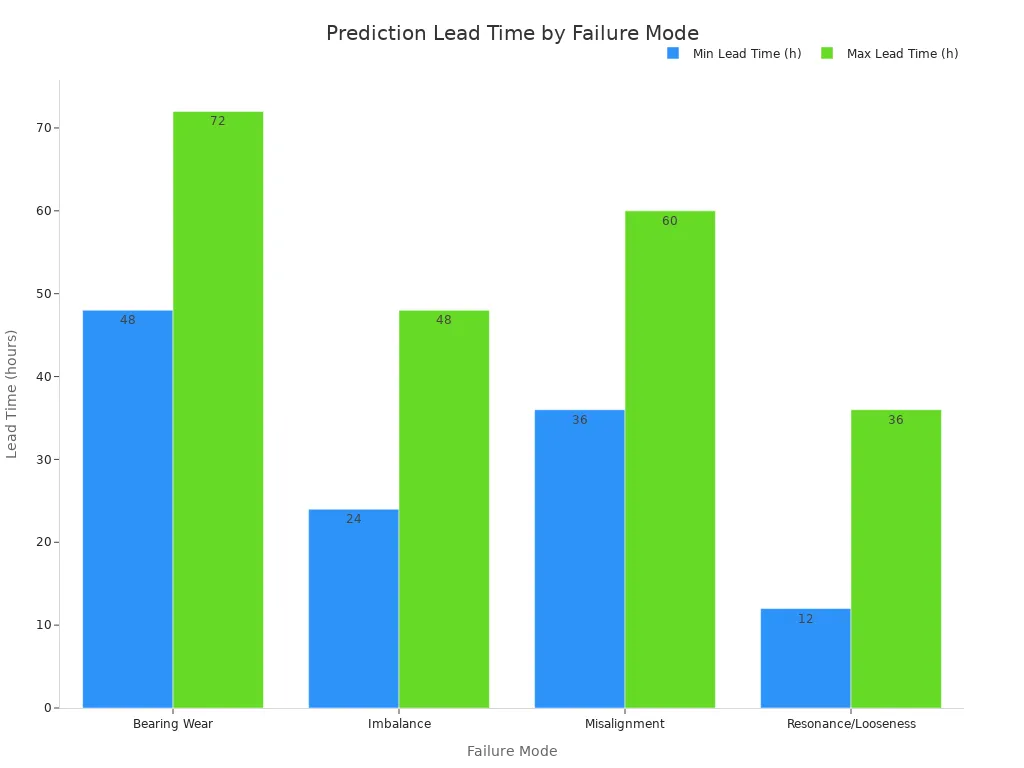
One frame monitoring 1,200+ spindles achieves 94% alert confidence. The 48-hour lead time allows planned bearing replacement, which costs 3–6x less than reactive replacement.
Sensor data feeds AI pattern analysis. Models analyze historical failure patterns and live readings. Anomalies appear days in advance. Supervisors receive targeted alerts ranked by urgency. Each alert specifies the machine, component, and required action. Maintenance executes during planned windows. Every action gets logged, improving future predictions. Companies using AI-driven predictive maintenance report up to a 10x ROI. One manufacturer saw a 40% reduction in unexpected failures. Overall costs lowered by up to 25% through fewer emergency repairs.
This combination of structured checklists, IoT monitoring, and AI analysis makes reducing unplanned downtime achievable. Entry-level predictive maintenance starts with production analytics: monitoring output rates and quality pass rates. This requires no new sensors and delivers immediate insight. Smart manufacturing relies on production analytics to guide every decision. Teams stop reacting and start predicting.
KPIs for Unplanned Downtime Reduction
Leading Indicators: Alert Frequency and Predictive Hit Rate
Leading indicators warn teams before failures occur. Alert frequency tracks how many notifications the monitoring system generates per machine, per week. A sudden spike in vibration or temperature alerts signals a developing fault. A steady decline in alert volume across a fleet points to improving machine health. Plant managers watch this trend to confirm that maintenance work is actually removing root causes.
Predictive hit rate measures how often an alert leads to a confirmed fault. A high hit rate means the system flags real problems instead of noise. A low hit rate wastes technician time on false alarms. Teams review hit rate monthly and adjust sensor thresholds accordingly. Production analytics platforms make this review fast, because they tie every alert to the work order it generated. Together, these two indicators show whether the predictive program is sharpening or drifting.
Lagging Indicators: MTBF, MTTR, and Overall Equipment Effectiveness
Lagging indicators confirm results after the fact. Mean Time Between Failures (MTBF) tracks equipment reliability and how long machines run before failing. A rising MTBF means fewer breakdowns. Mean Time to Repair (MTTR) measures how quickly crews restore equipment after a breakdown. A falling MTTR means faster recovery and less production loss.
| KPI | Definition |
|---|---|
| MTBF | Average operating time between one failure and the next |
| MTTR | Average time required to restore equipment after a breakdown |
| OEE | Availability × Performance × Quality, expressed as a percentage |
Overall Equipment Effectiveness (OEE) combines availability, performance, and quality into one number. Availability captures downtime directly. Tracking these three metrics validates the reduction strategy. In tyre manufacturing, focusing on MTTR and MTBF helped reduce downtime by over 25% in less than a year. Production analytics dashboards keep these numbers visible, so leaders can connect maintenance actions to financial outcomes. Spare parts availability and first-time fix rate round out the picture, since both extend or shorten every stoppage.
Common Myths About Predictive Maintenance
Myth 1: “Predictive Care Is Too Expensive for Us”
Plant leaders often assume that predictive care demands a massive capital investment. That assumption no longer holds. Mid-sized manufacturers now access enterprise-grade tools at mid-market prices. Factory AI, for example, targets the mid-market directly. Users report a 70% reduction in unplanned downtime and a 25% reduction in maintenance costs within the first quarter of deployment. Those results arrive without a full hardware overhaul.
Brownfield-friendly platforms pull data from existing PLCs, SCADA systems, and third-party sensors. Plants with mixed-age equipment avoid replacing every machine on the floor. This approach lowers the entry barrier considerably. A mill can start with one critical asset, prove the return, and expand from there. The cost of one avoided breakdown often covers the entire pilot.
Myth 2: “We Need Data Scientists to Make It Work”
Another persistent belief claims that predictive maintenance requires an in-house analytics team. Modern solutions have dismantled that barrier. Factory AI provides a no-code interface with pre-trained models for common industrial assets such as motors, pumps, and compressors. Maintenance technicians operate the system without training AI models themselves.
Several platforms now design their tools for the people who actually fix machines. TRACTIAN combines wireless sensors with software built for maintenance technicians, not data scientists. Its interface monitors vibration, temperature, and electrical signatures through a technician-friendly dashboard. Fiix offers a user-friendly CMMS with predictive features for teams new to digital tools. UpKeep delivers a mobile-first experience for crews working on the go. These options make smart manufacturing accessible to plants without specialized analytics staff. A maintenance planner can review alerts, schedule repairs, and close work orders inside one unified workflow.
Real-World Success Stories
How a Loom Plant Cut Unplanned Stoppages by 50%
A mid-sized weaving plant operated 60 looms across two shifts. Unplanned stoppages consumed 14 hours per week on average per loom. Bearing failures, reed damage, and lint accumulation in shedding mechanisms caused most incidents. The maintenance team lacked visibility into machine health between scheduled rounds. Teams responded reactively, often waiting hours for spare parts and technician arrival. One major failure could idle an entire production line for the rest of the shift.
The plant adopted a combined preventive and predictive approach. Maintenance teams built daily checklists for lubrication, lint removal, and bearing temperature checks. They deployed IoT vibration sensors on the 40 looms responsible for the highest downtime minutes. Production analytics tracked output rates, quality pass rates, and downtime events per machine. The sensor system flagged rising vibration signatures weeks before failure. Teams scheduled bearing replacements during planned weekend stops instead of waiting for breakdowns. Within five months, unplanned stoppages dropped by 50%. Overall equipment effectiveness rose from 68% to 79%. The plant recovered its investment within the first year.
Furniture Plant Reduces Spindle Failures with Vibration Sensors
A furniture plant producing upholstery fabric operated 30 spinning frames. Spindle bearing failures caused 22% of all downtime, more than any other single cause. Each failure required emergency replacement, idle labor, and lost output. The maintenance budget was consumed by reactive repairs.
Technicians installed wireless vibration sensors on the bearing housings of every spinning frame. The predictive maintenance system, trained on historical failure data, issued alerts when high-frequency vibration exceeded normal thresholds. Lead time averaged 72 hours before bearing seizure. The team combined sensor alerts with a preventive lubrication schedule. Spindle failures dropped by 70% within six months. Unplanned downtime fell by 35%. The plant later expanded sensor coverage to cutting and finishing lines. Production analytics from the spinning frames guided decisions on where to deploy sensors next. This implementation demonstrates smart manufacturing in textile operations. The combination of sensor data and structured work orders created a repeatable process for reducing failures.
Unplanned downtime remains a costly burden for textile plants. Shifting from reactive repairs to predictive care transforms this challenge. Teams can reduce failures significantly by following proven tactics.
These tactics include building a structured maintenance plan. They also involve deploying IoT sensors for early warnings. Fixing spare parts shortages and tracking KPIs like MTBF and OEE complete the approach.
Predictive maintenance systems typically decrease unexpected equipment failures by 40-60% in cotton ginning plants, representing the most significant value driver for unplanned downtime reduction.
Plant leaders should start small. Pilot predictive care on one critical asset. Then invest in a solution like L2L that integrates tracking, monitoring, and technician response. This path makes reducing unplanned downtime a practical achievement.
FAQ
How much can predictive care reduce unplanned downtime?
Results vary by plant and asset. Research cited in this article shows facilities with full maintenance strategies cut unplanned downtime by an average of 52% within 18 months. Predictive programs using sensors and analytics can reach higher reductions. Cotton ginning plants typically see a 40–60% drop in unexpected failures.
Which machines should a plant monitor first?
Start with the assets that cause the most downtime minutes. One weaving plant placed sensors on the 40 looms with the highest stoppage hours. A furniture plant began with spinning frame bearings, its single largest failure source. Production analytics on output and quality rates identify these candidates without new hardware.
Do plants need vibration sensors to begin?
No. Entry-level predictive care starts with production analytics. Teams track output rates, quality pass rates, and downtime events per machine. This step requires no new sensors and often shows ROI within 60–90 days. Vibration monitoring comes next, targeting the confirmed problem assets.
How far in advance do vibration alerts warn of failure?
Lead time depends on the failure mode. Bearing wear generates high-frequency impacts that provide 48–72 hours of warning. Imbalance offers 24–48 hours. Misalignment gives 36–60 hours. Resonance and looseness yield 12–36 hours. This window lets crews schedule repairs during planned stops.
What does a reactive repair cost compared with a planned one?
Unplanned downtime carries a 3–5x cost multiplier over planned work. A planned bearing replacement costs 3–6x less than a reactive one. Hidden costs add more: overtime labor, scrap, expedited shipping, and late-order penalties. Planned shutdowns also avoid the rushed decisions that extend every breakdown.
See Also
How AI Predictive Maintenance Transforms Textile Operations In 2025
Predictive Analytics Creates Balance In Fashion Supply And Demand
Predictive Models Transform Fashion Retail Operations In 2025
How Predictive Analytics Optimizes Retail Replenishment In 2025