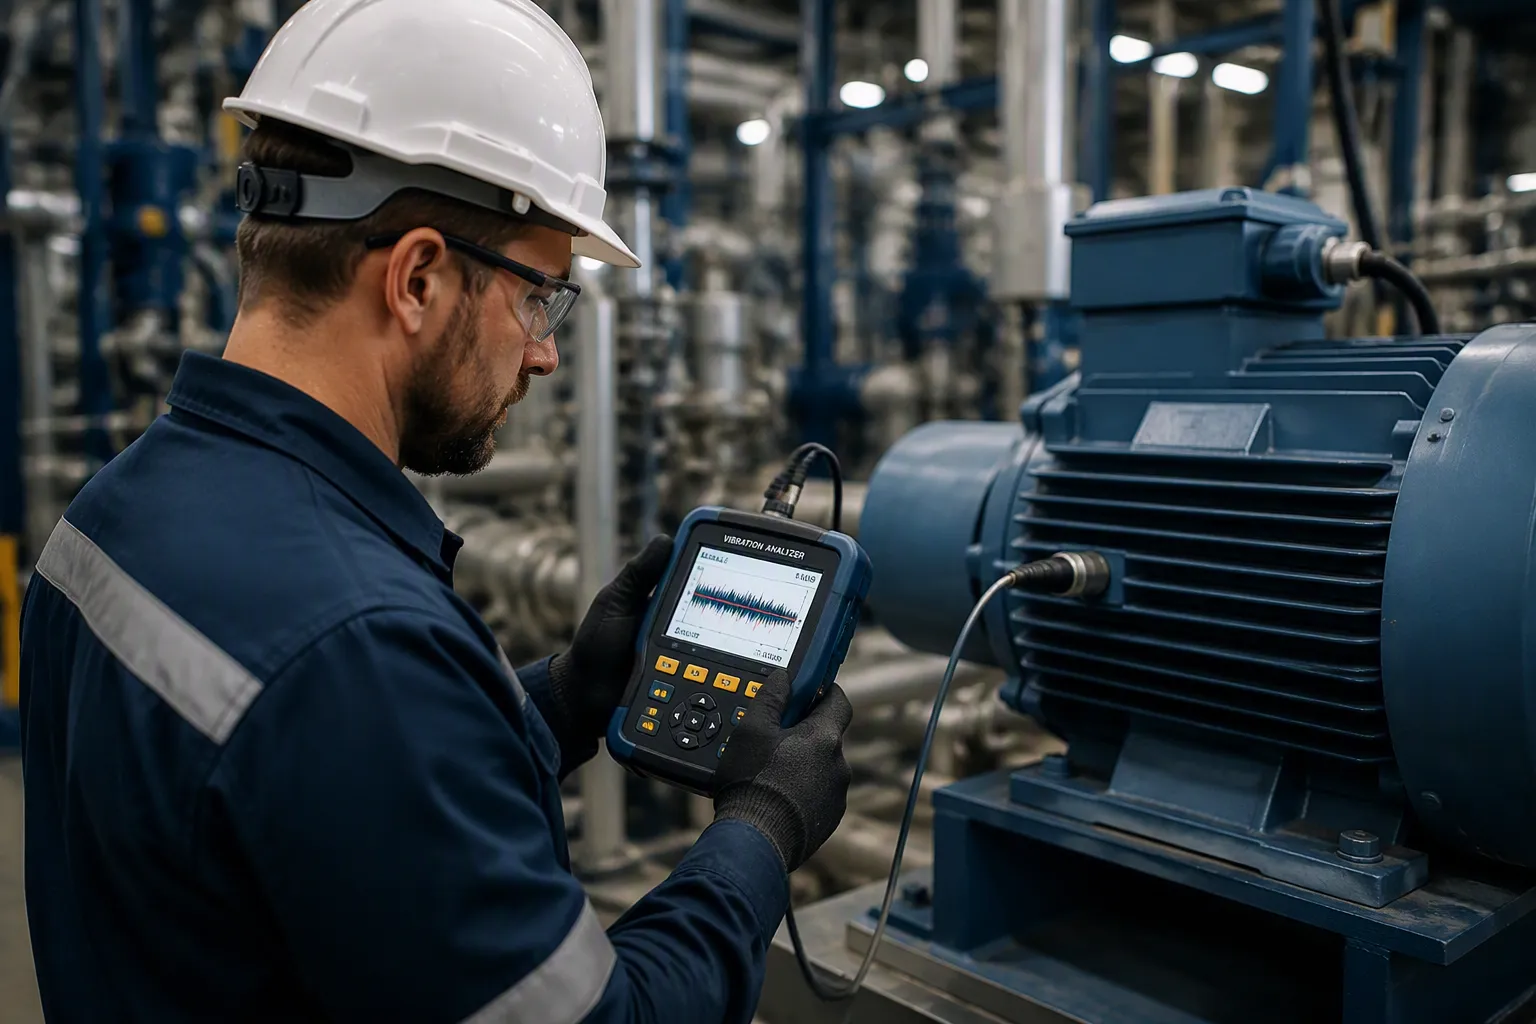
A pump on your line starts to whine. You ignore it. Three weeks later, it seizes and stops production for two days. A vibration analysis program would have flagged that failing bearing long before the breakdown.
Vibration analysis is the practice of measuring how much a machine shakes and at what frequencies. It serves as a core tool in predictive maintenance, catching equipment failure signs weeks in advance. This approach cuts downtime, lowers repair costs, and extends machine life. You can apply these methods to your own maintenance routine without a massive budget.
Predictive Maintenance Basics
Definition and Core Principles
Predictive maintenance is a proactive strategy that forecasts equipment failure before it happens. You monitor equipment condition using real-time sensor data. This approach relies on continuous analysis of vibration, temperature, and other parameters. Advanced algorithms detect early signs of malfunction. You then schedule interventions at the optimal moment.
This strategy is formally defined as a subset of condition-based maintenance. ISO 13381-1 provides the international standard for machinery condition monitoring. The core principles follow a clear sequence. First, you collect vibration signals alongside operational parameters such as speed and load. Second, you process raw time-domain signals into frequency-domain spectra. Third, you extract characteristic patterns that reflect machine condition. Fourth, you interpret those features to pinpoint specific defects. Fifth, you track deterioration over time and estimate remaining useful life. You compare each new reading against the baseline established during normal operation. Any deviation signals a potential fault. This five-step cycle transforms your approach. The condition-based maintenance approach optimizes machine lifespan and keeps production running.
Preventive vs. Reactive vs. Predictive
You have three strategies to choose from. Reactive maintenance means you run equipment until it breaks. You replace or repair components after failure. This approach costs 3 to 5 times more per repair event than planned maintenance. Preventive maintenance follows a fixed schedule. You service equipment at regular intervals regardless of its actual condition. IBM research shows that 30% of preventive tasks are unnecessary. You waste labor and parts on machines that do not need service yet. Predictive maintenance offers a better path. You base actions on actual equipment condition and real-time data. You fix problems before they cause breakdowns.
Here is how the three strategies compare on key metrics. The table shows cost differences, downtime reduction, and typical uptime levels.
| Strategy | Cost vs Preventive | Downtime vs Reactive | Typical Uptime |
|---|---|---|---|
| Reactive | 3–5× higher | — | 75–82% |
| Preventive | Baseline (1.0×) | 20–30% reduction | 88–94% |
| Predictive | 18–25% lower | 35–50% reduction | 94–98% |
These numbers come from industry benchmarks including the U.S. Department of Energy and McKinsey & Company. The pattern is clear. Each step up the maturity scale reduces costs and improves reliability. A predictive maintenance program delivers 25–35% total cost reduction compared to scheduled preventive work. You also see 70–75% fewer unplanned failures. Unplanned downtime costs manufacturers an estimated $50 billion annually. A predictive approach goes further. You cut costs by 18–25% below preventive levels. You extend asset lifespan by 20–40%.
What Is Vibration Analysis
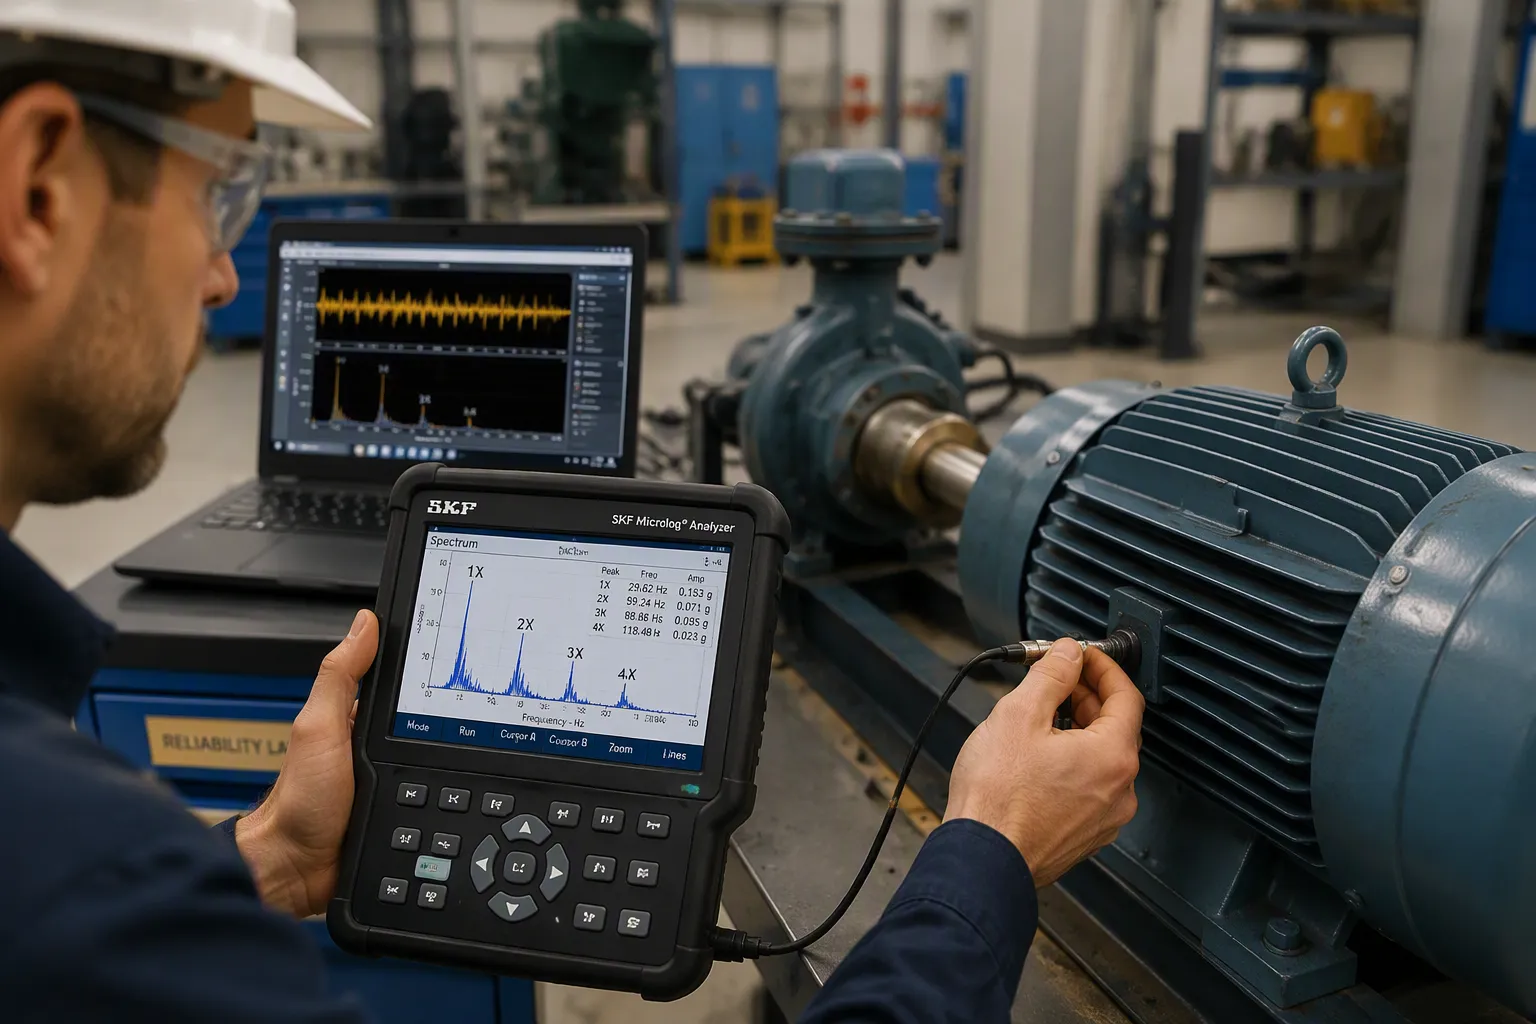
Vibration analysis is the cornerstone of predictive maintenance. It stands as the main non-invasive method for locating and predicting faults in rotating machine components. Every machine vibrates as it runs. That vibration carries a story about the health of its internal parts. By measuring how much a machine shakes and at what frequencies, you can read that story and act before a small problem becomes a costly breakdown.
Vibration analysis for predictive maintenance monitors the vibrations of machines such as motors. By analysing these vibrations, engineers can gain insight into the condition of the machine and predict when it might fail. This allows them to carry out maintenance to prevent the possible failure and extend the machine's working life. A major cause of failures is wear and misalignment in components such as bearing races, gear wheels and shafts... Left unchecked, these vibrations can lead to further damage and ultimately failure.
How Vibration Signals Reveal Faults
A vibration signal is a time waveform. It shows how much a machine moves back and forth over time. You convert that waveform into a frequency spectrum using a Fast Fourier Transform (FFT). This algorithm breaks the signal into its constituent frequencies. Each frequency maps to a specific mechanical component. The 1× running speed peak points to the shaft. Higher harmonics point to gears, bearings, or couplings.
This is where condition monitoring becomes powerful. A healthy machine produces a stable, predictable spectrum. A developing fault changes that pattern in a measurable way. You compare each new reading against the baseline you captured during normal operation. Any deviation signals early signs of degradation. Phase measurement adds another layer. It compares the timing of vibration at different points on the machine. This helps you distinguish faults that produce similar spectra.
Common Faults Detected
Four rotating machine faults account for roughly 90% of cases: misalignment, imbalance, looseness, and bearing wear. Each one leaves a distinct signature in the vibration data.
| Fault | Vibration Signature | Affected Components |
|---|---|---|
| Imbalance | Dominant peak at 1× running speed; present in radial direction | Fans, pumps, rotors, impellers |
| Misalignment | Elevated 1× and 2× peaks; axial vibration prominent; phase difference across coupling | Shaft couplings, motor-pump sets, gearbox input shafts |
Bearing wear is the single largest failure mode. Bearing problems account for 51% of all motor failures. Early bearing degradation shows up as high-frequency energy in the 20–40 kHz range. At this stage, you hear no abnormal noise and see no temperature deviation. The low-frequency spectrum stays clean. Only continuous monitoring captures these subtle shifts between inspection cycles. Characteristic defect frequencies appear as non-integer multiples of shaft speed, often at very low amplitudes.
Vibration analysis supports maintenance decision-making by evaluating equipment condition. You spot the early indicators of fault before they escalate. You track each fault condition over time. You then schedule repairs at the optimal moment. This approach turns a reactive repair into a planned intervention.
Vibration Analysis in Predictive Maintenance
Why It Matters for Rotating Equipment
Vibration analysis anchors any predictive workflow for rotating machinery. Pumps, motors, fans, and compressors all produce distinct vibration patterns during normal operation. When a developing fault appears, those patterns change in measurable ways. You catch the early signs of degradation before the machine fails.
Real financial returns follow. Predictive maintenance delivers documented maintenance cost reductions of 18–25% and unplanned downtime reductions of 30–50% versus reactive strategies. One example proves the point. A manufacturer installed a vibration sensor on a CNC milling machine linked to a CMMS. The sensor detected a spindle bearing anomaly and triggered an automated work order. A technician replaced the bearing before failure. This avoided 8 hours of downtime at $10,000 per hour plus $5,000 in emergency shipping. Total savings reached $85,000 against $35,000 in program costs — a $50,000 net gain from one caught fault.
Condition-based maintenance depends on vibration monitoring to track these patterns. Compare each new reading against the baseline. Any deviation signals a potential fault. This constant monitoring catches issues that periodic checks miss. Bearing wear and imbalance show up in the vibration data.
Key Benefits for Maintenance Teams
Vibration analysis changes how your team operates. You plan interventions around production schedules instead of reacting to breakdowns. Equipment failures often happen suddenly and under load, creating hazardous conditions. Preventing those failures reduces exposure to safety incidents.
The benefits span multiple areas:
- Reliability and safety: Spotting mechanical faults early reduces the risk of hazardous failures and improves operational stability.
- Lower costs: Early wear detection allows targeted repair instead of expensive full-part replacement.
- Equipment lifespan: Finding imbalances and misalignments keeps machines running at peak efficiency.
- Less downtime: Continuous analysis catches faults before unexpected breakdowns occur.
- Better planning: Predictive insights enable accurate scheduling and efficient resource use.
- Compliance support: Regular checks ensure equipment meets regulatory and performance standards.
Your team spends less time on emergencies and more time on planned work. This shift improves morale and lets skilled technicians focus on high-value tasks. This approach embodies condition-based maintenance: act based on actual condition, not a fixed schedule. A successful predictive maintenance program weaves vibration analysis into your CMMS. The vibration data tells you when to act and what to fix. You track each degradation path over time and schedule repairs at the optimal moment.
Implementing Vibration Analysis
Techniques and Measurement Points
You start by choosing which assets deserve attention. A hybrid monitoring strategy driven by asset criticality beats monitoring everything equally. Rank every equipment item on a 1–10 scale across production impact, safety, repair cost, and mean time between failures. Then deploy your resources in tiers:
- Tier 1 (Most Critical): Apply wired online monitoring to roughly the top 5% of assets whose failure would halt the entire plant.
- Tier 2 (Essential): Use wireless vibration sensors for the 60–70% of balance-of-plant assets such as motors, pumps, and fans that matter but may have redundancy.
- Tier 3 (Non-Critical): Rely on portable data collectors for remaining or infrequently run assets so nothing goes unmonitored.
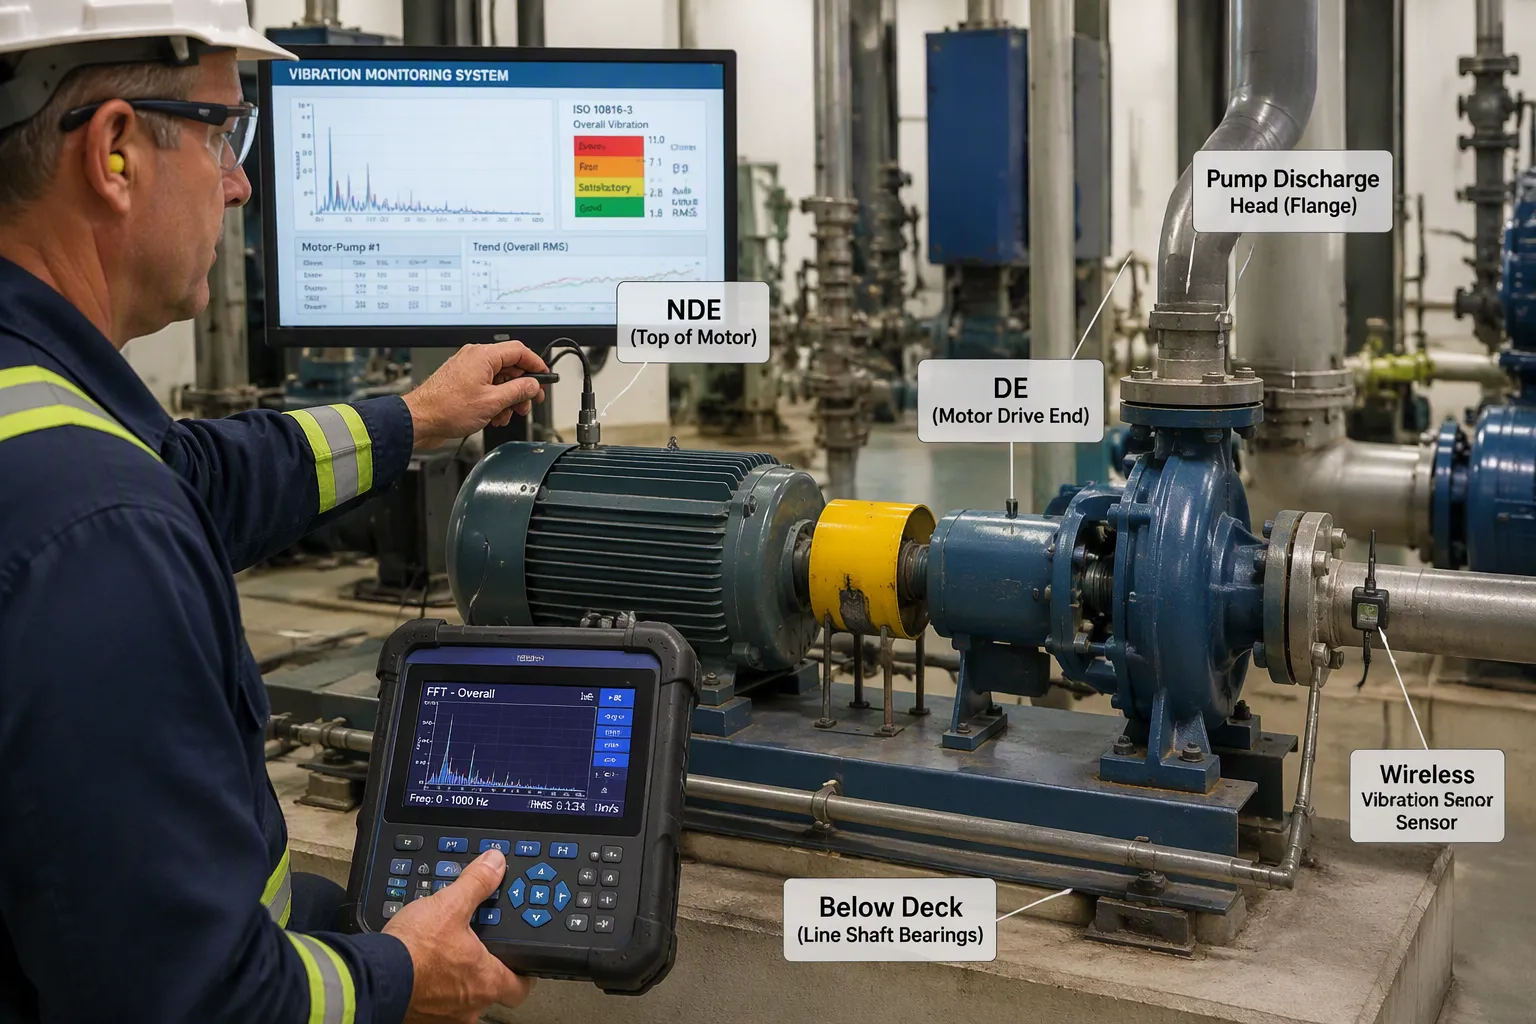
Next, select measurement points on each machine. For a motor-pump assembly, follow this sequence:
- Top of Motor (NDE) – Usually the point of maximum amplitude; measure in two radial directions plus axial.
- Motor Drive End (DE) – Located closer to the coupling.
- Pump Discharge Head (Flange) – Crucial for detecting foundation issues.
- Below Deck (line shaft bearings) – Usually inaccessible while running, so infer health from energy transmitted to the surface.
Always measure in all three planes (horizontal, vertical and axial) at both the pump and motor bearings. A fault that is dominant in one plane can be completely invisible in another.
Then set baselines. ISO 10816 establishes alert and alarm thresholds based on baseline data for rotating equipment. ANSI/HI 9.6.4 provides pump vibration acceptance values in overall RMS velocity. Use this table as your starting reference:
| Parameter | Measurement Unit | Action Threshold |
|---|---|---|
| Overall Vibration Velocity | mm/s RMS | >4.5 mm/s (ISO Class II) |
Finally, collect vibration data continuously. FFT analysis is arguably the most effective technology for detecting and tracking rolling element bearing failure. It identifies faults long before they are audible or cause a temperature increase.
Vibration Sensors and Tools
Wireless vibration and temperature sensors measure RMS velocity in inches per second or millimeters per second, along with surface temperature. These devices let you assess pump and motor condition without shutting down production. Engineers gather vibration data continuously and compare each reading against the baseline.
Sensor specifications vary by application. A triaxial 200g sensor records peak or RMS values. The Erbessd GP8 connects to ICP piezoelectric accelerometers and measures velocity RMS every 5 minutes. The Crystal Instruments Ruby covers 0.5 Hz to 6.5 kHz on its Z-axis with amplitude accuracy of ±1 dB to ±2 dB.
For early-stage bearing defects, envelope analysis isolates high-frequency impacts. You bandpass-filter the raw signal around 5–40 kHz, rectify it, then perform an FFT on the resulting envelope. This reveals low-frequency bearing defect frequencies even when structural resonances mask them. This approach supports machine condition monitoring by catching degradation before it escalates. Your maintenance team then schedules repairs at the optimal moment.
CMMS Integration
Automating Alerts and Work Orders
A computerized maintenance management system (CMMS) turns raw readings into action. You link your sensors to the platform, and the software compares each new value against your thresholds. When a reading crosses the limit, the system raises an alert on its own. This is automated fault detection in practice, and it removes the wait for someone to review charts by hand.
The payoff is speed. Maintenance teams receive immediate alerts, and reaction time drops from weeks down to hours. A validated alert can instantly generate a work order, so the loop between detection and corrective action closes without manual entry.
| Step | Action | Impact |
|---|---|---|
| Work Order Auto-Created in CMMS | CMMS receives a validated alert and instantly generates a work order | Removes manual entry and shortens response time |
Sensors can send real-time data to CMMS, such as temperature, humidity, or vibration readings. The software can then generate alerts or even create work orders automatically when equipment is operating outside of normal conditions.
Tracking Trends and History
Trend tracking gives your vibration data a memory. The CMMS stores every reading, so you watch a bearing degrade across months instead of guessing from one snapshot. Dashboards and analytics visualize asset utilization, which helps you spot a slow drift before it becomes a failure.
History builds the feedback loop. Each completed work order records what failed, what you replaced, and how long the repair took. Your next prediction draws on that record. Over time, the system learns which assets fail most and when, and your predictive maintenance program gets sharper with every cycle.
This is condition-based maintenance at scale. You schedule work only when a machine health parameter like vibration or temperature reaches a preset threshold. Technicians then address developing problems such as misalignment or bearing failure before total asset failure and unplanned downtime. Your monitoring effort shifts from reacting to breakdowns to planning repairs around production.
Vibration analysis is a proven, actionable pillar of predictive maintenance. It catches faults weeks before failure, so you cut downtime, lower repair costs, and extend equipment life.
Start with your most critical assets. Establish baselines during normal operation. Then integrate the data into your CMMS, so alerts and work orders flow automatically.
You do not need a plant-wide rollout on day one. Pick one pump or motor, prove the value, and scale up. Your maintenance team can begin small today and build a smarter, more reliable operation over time.
FAQ
How much does a vibration analysis program cost to start?
You can begin with a single wireless sensor on one critical asset. The article's CNC milling example shows $35,000 in program costs returning $85,000 in avoided losses. Scale up only after you prove value on that first machine.
Which machines benefit most from vibration analysis?
Rotating equipment delivers the clearest returns. Pumps, motors, fans, and compressors all produce distinct vibration patterns. Bearing wear causes 51% of motor failures, so any asset with rolling element bearings deserves priority. Rank each machine on production impact, safety, and repair cost before you deploy sensors.
How often should you collect vibration data?
Continuous wireless sensors typically sample every few minutes, which catches early bearing defects in the 20–40 kHz range that periodic routes miss. Portable collectors suit non-critical assets. Match your collection interval to how fast a fault would develop on each machine.
What standards guide alarm thresholds?
ISO 10816 sets alert and alarm thresholds for rotating equipment. ANSI/HI 9.6.4 provides pump vibration acceptance values. ISO 13381-1 covers machinery condition monitoring generally. Use these as starting references, then adjust thresholds against your own baseline data.
Can vibration analysis replace preventive maintenance entirely?
No. Most plants run a hybrid approach. You keep scheduled tasks for non-critical assets and apply condition-based monitoring where failure costs are high. This blend captures the 18–25% cost reduction that predictive programs deliver over purely preventive work.
See Also
Artificial Intelligence Predictive Maintenance Transforming Textile Manufacturing Operations By 2025
Using Predictive Analytics To Optimize Retail Inventory Replenishment Strategies In 2025
How Enterprises Use AI To Improve Production Forecasting Accuracy In 2024
Innovative Technologies Revolutionizing The Way Material Handling Operations Work Today
Effective Innovative Strategies For Maintaining Accurate Inventory Records In 2025