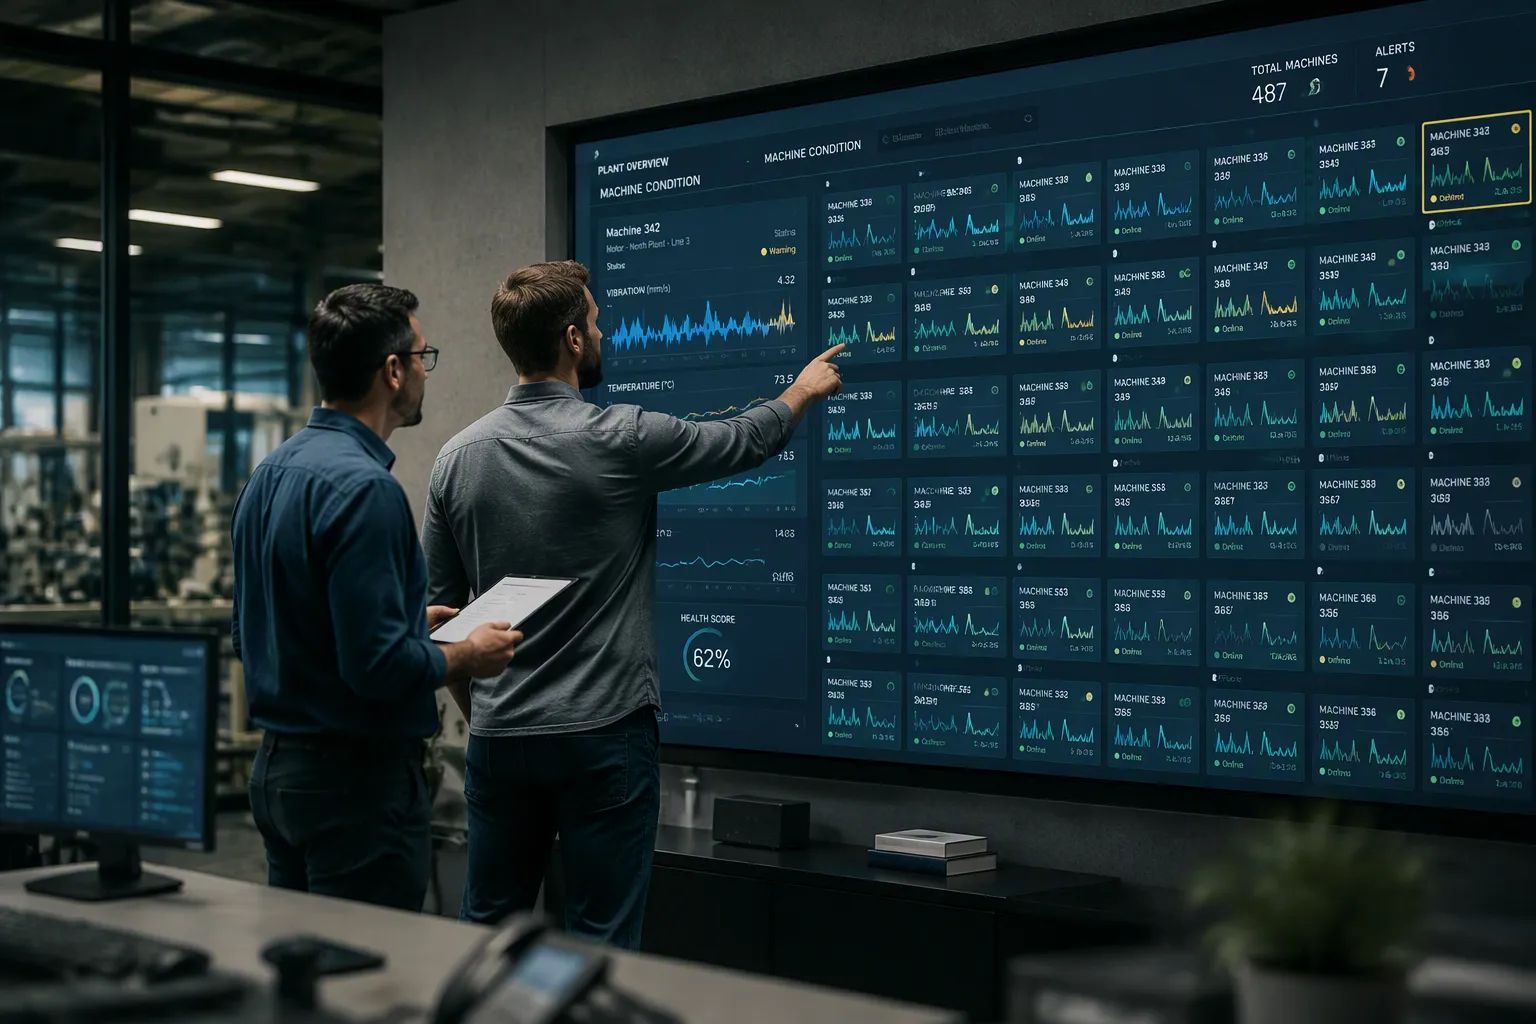
You cannot manually watch hundreds of machines. Condition monitoring at scale demands automation, not more analysts. Every new pump or motor adds data streams, noise, and false alarms. Your team faces a hard choice. Add headcount or build a smarter system.
The tension is real. More equipment means more data. More data means more noise. More noise means missed failures. Yet you cannot sacrifice accuracy or let costs spiral. Traditional maintenance approaches crumble under this weight. You need a different path.
This post gives you an architectural blueprint. You will learn how to build a scalable data pipeline, apply analytics, design alerts, and roll out in phases. The iot platform you choose matters. The iot strategy you deploy matters more.
Why Condition Monitoring Breaks at Scale
Most facilities begin with 20 to 50 condition monitoring sensors on critical equipment. This approach works well at first. Then you add more machines. The system hits a wall. Condition monitoring at scale exposes problems that small deployments never reveal.
Data Volume and Cost
Every sensor generates a constant stream of readings. Vibration sensors alone produce thousands of samples per second. Multiply that by hundreds of machines. Now you face millions of data points each day. Storage costs grow fast without the right architecture. Your iot platform must handle this flow without crashing or draining your budget.
Consider a plant with 300 motors and 120 pumps. Each motor carries two condition monitoring sensors. Each pump carries one. That totals 720 sensors. At high sampling rates, this plant generates terabytes of data every month. A relational database cannot keep up. Query times slow to a crawl. Reports that once took seconds now take minutes.
Noise and Alert Fatigue
Too many false alarms destroy trust in your system. Technicians stop responding to alerts. Real failures slip through the noise. This problem grows worse as you add more equipment. Each machine has its own normal operating pattern. A one-size-fits-all threshold triggers alerts on healthy industrial equipment.
Your team needs reliable detection, not more noise. When false alarms flood the dashboard, predictive maintenance becomes reactive again. The promise of fewer surprises disappears. Unplanned downtime returns. The whole point of condition monitoring fades.
A good predictive system learns each machine's baseline. It separates real problems from normal variation. Without this, your maintenance team drowns in alerts. They miss the one signal that matters. That missed failure costs far more than the monitoring system itself.
Architectural Blueprint for Condition Monitoring
A scalable industrial iot platform grows from a dozen condition monitoring sensors to hundreds without geometric cost increases. The architecture rests on three tiers: field devices, edge gateways, and centralized aggregation. Each tier handles a specific job. Together, they deliver real-time insights without overwhelming your network or your budget.
Sensors and Edge Gateways
Condition monitoring sensors capture vibration, temperature, and current data. Industrial IEPE accelerometers typically cover 0.5 Hz to 10 kHz, with measurement ranges from ±2g to ±500g. For motor monitoring, the relevant vibration bandwidth is usually 10 Hz to 1 kHz. Wireless sensors often cap at about 2 kHz due to internal electronics.
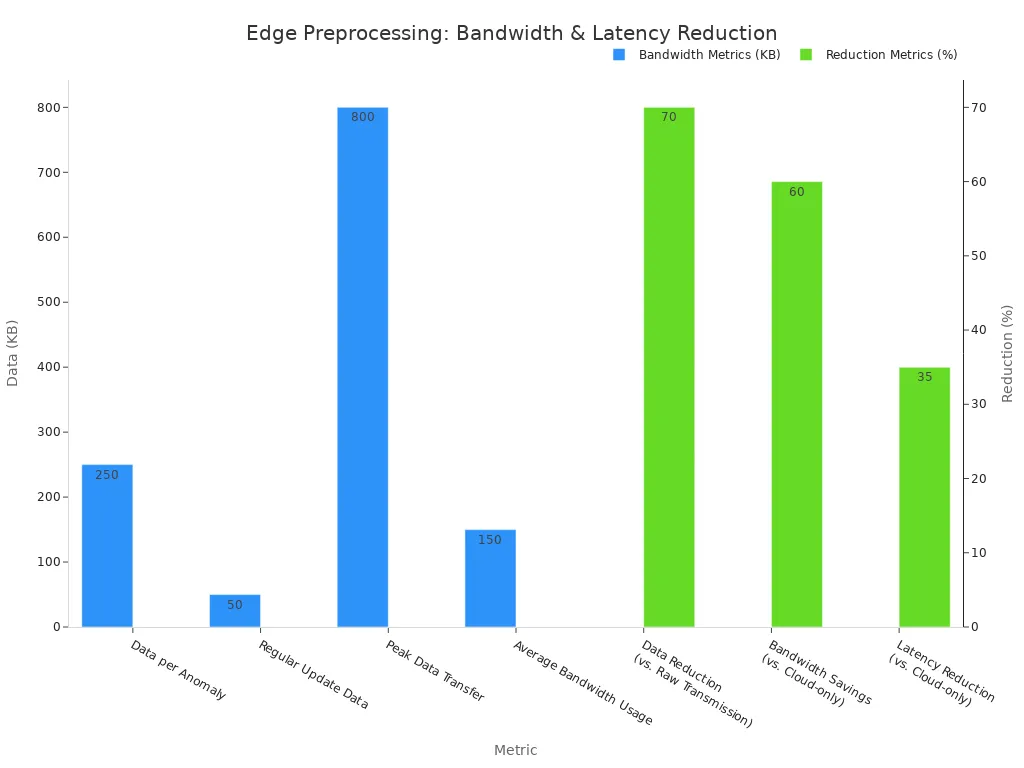
Edge gateways perform local preprocessing. They apply filtering, noise reduction, and Fast Fourier Transforms (FFTs) to convert time-domain data into frequency-domain data. This reduces the data sent to the cloud by 70% compared to raw transmission. Bandwidth savings reach 60% versus cloud-only processing, and latency drops by 35%. A gateway also runs lightweight AI models to detect anomalies in real time. Only significant events and periodic updates travel upstream.
Cloud or On-Prem Aggregation
Centralized aggregation stores data and runs fleet-wide analytics. You choose between cloud and on-prem based on latency, cost, and scale. On-premise edge delivers 2–15ms alert latency, which suits high-speed spindles and turbine bearings. Private cloud typically delivers 50–150ms round-trip, while public cloud adds 200–500ms. Public cloud offers instant elastic scaling but incurs variable data egress costs.
For a plant with 500 assets, on-premise demands upfront CapEx of roughly $50,000–$150,000. Cloud requires no upfront investment yet produces a 2–4× difference in five-year TCO depending on data volume. Large single-site deployments often require several years to recoup the upfront investment, while distributed operations with fewer monitoring points typically retain a cloud advantage.
Building a Scalable Data Pipeline
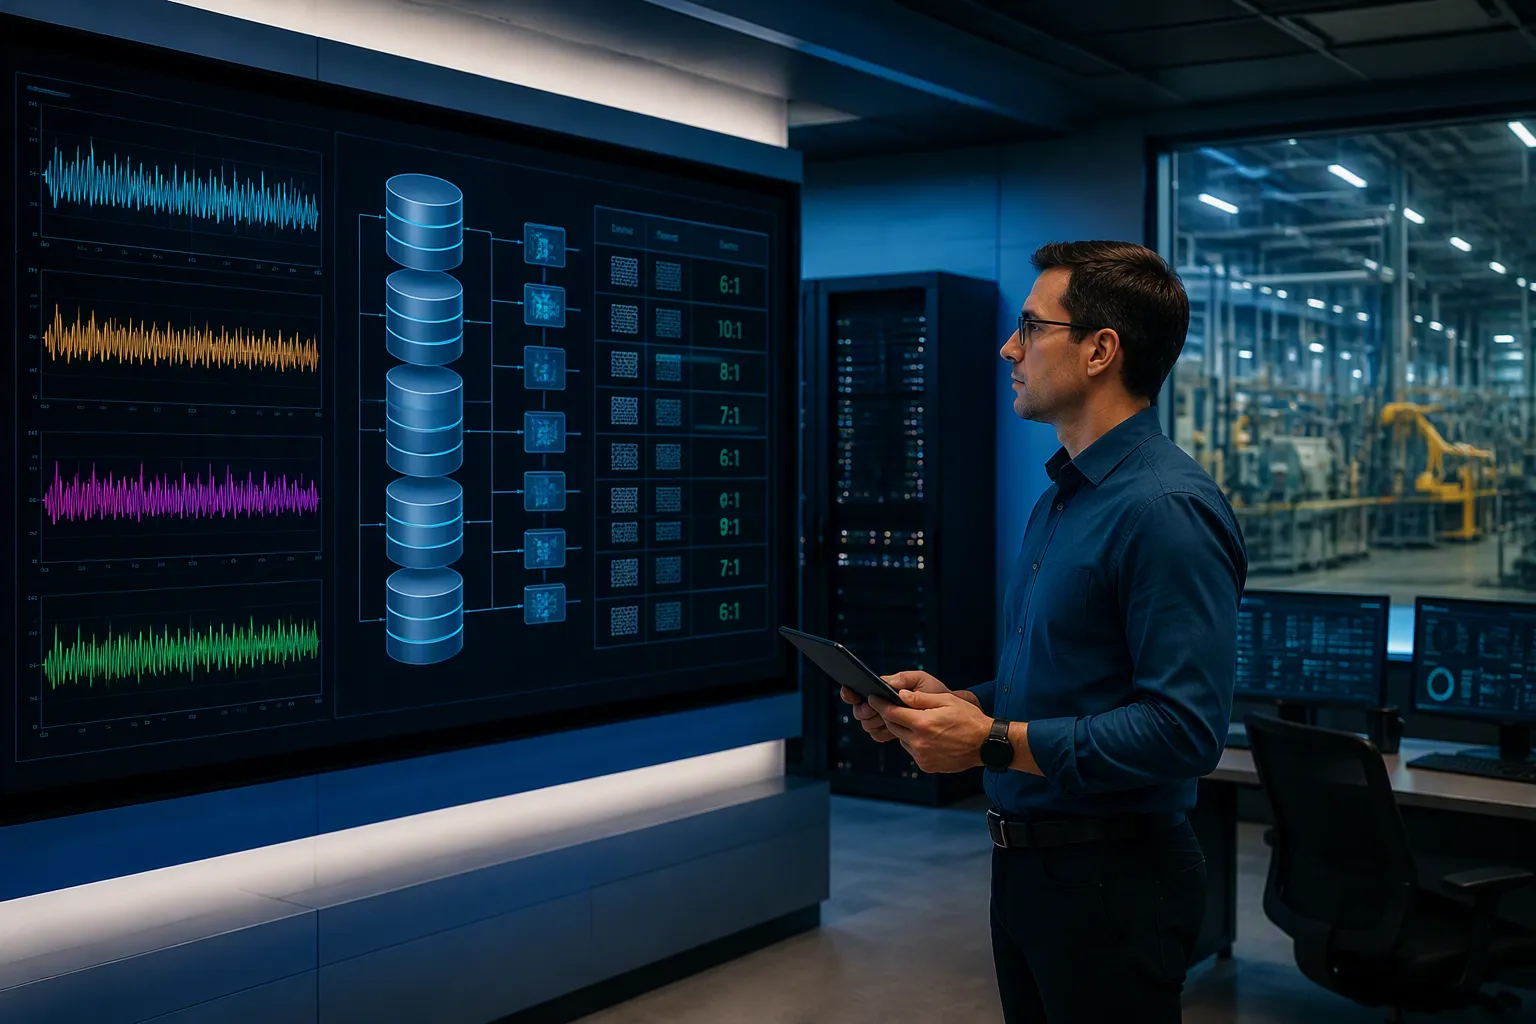
A scalable pipeline moves condition monitoring data from hundreds of sensors to storage without choking your network or your budget. The right pipeline design determines whether your system stays affordable as you grow.
Time-Series Storage and Compression
Time-series databases (TSDBs) store sensor readings far better than relational databases. A relational database intermixes different data types within each row. A TSDB groups all values of a single column together. Adjacent values look similar, so they compress well. This columnar approach uses less storage and less I/O than row-oriented storage. It also handles large-scale analytics and aggregations over time-series data efficiently.
Compression techniques deliver dramatic savings. Delta encoding stores timestamp differences instead of full values. For data arriving every second, the delta stays constant and compresses to almost nothing. Delta-of-delta encoding pushes further. Columnar storage enables type-specific encoding. Together, these methods deliver substantial storage reductions.
Not all TSDBs handle high-frequency vibration data equally well. General-purpose time-series designs struggle as frequency rises to high sampling rates. Write times increase and read performance degrades with larger datasets. Databases built specifically for unstructured time-series data use binary chunk storage. They maintain consistent read and write performance across all tested frequencies.
Sampling and Retention Strategies
You cannot store every reading forever. Downsampling reduces data volume while preserving diagnostic value. Time-based downsampling is the most common approach for industrial time-series data. It uses time-bucketed aggregation grouped by hour or day.
| Aggregation Method | Description | Typical Use |
|---|---|---|
| Average (Mean) | Computes arithmetic mean within a time window | Hourly temperature averages from minute-level data |
| Min/Max | Captures range of values within each period | Detecting equipment limits and peak conditions |
| Count/Sum | Aggregates discrete events and cumulative measurements | Event counting and energy consumption |
A tiered retention pattern balances cost and diagnostic need, for example keeping recent data at high resolution and older data at lower resolution. This approach controls storage costs while preserving recent detail for fault diagnosis.
Analytics and Predictive Maintenance at Scale
AI automates fault diagnosis across hundreds of machines. Condition monitoring at scale demands this automated approach. Your team no longer inspects each asset manually. The system learns from hundreds of sensors. It finds problems before failure using fleet-wide analytics. This shift changes how you approach condition monitoring entirely.
Fleet-Wide Anomaly Detection
Anomaly detection works differently across a fleet versus per-asset baselines. Per-asset models take time and ignore relationships between similar equipment. Fleet-based methods compare machines against each other in real time. Your data analytics system processes these comparisons.
Hierarchical clustering offers an effective approach. It uses pairwise machine comparisons to group similar equipment. The anomaly score measures how many machines fall outside each cluster. The assumption stays simple: at least two-thirds of machines run healthy. This framework does not require historical data. It leverages online comparisons across the fleet. Your analytics engine processes this information. For heterogeneous fleets, expert knowledge helps select comparable subsets.
Isolation forest and autoencoders also serve detection tasks. They identify deviations in vibration and current waveforms. They detect early warning signs that traditional thresholds miss. The system flags unusual patterns across hundreds of machines simultaneously. This gives you actionable insights. Fleet-wide analytics delivers performance data for every asset. Your iot platform supports these comparisons efficiently.
Fault Classification and Diagnostics
Pattern recognition classifies known failure modes with high accuracy. Deep learning models achieve high accuracy for bearing fault diagnostics. A CNN combined with LSTM performs particularly well for rolling element and race faults. These models handle noisy environments well. All sensor data feeds into these classification models.
Real-world conditions vary. Speed and load change constantly. Your system must generalize across these variations.
Predictive maintenance shifts your team from reactive to proactive work. Instead of fixing machines after breakdown, you schedule repairs during planned windows. This reduces unplanned downtime and extends equipment life. The system classifies faults into categories like bearing wear, misalignment, or imbalance. Each diagnosis guides your team to the right repair. Predictive maintenance helps you plan parts inventory. This predictive approach optimizes performance across all assets. A predictive model learns from every new data point. Your iot sensors feed real-time information to the analytics engine. The equipment health dashboard shows each machine's status clearly. Industrial equipment reliability improves as the system learns from more machines.
Alerts and Dashboards That Drive Action
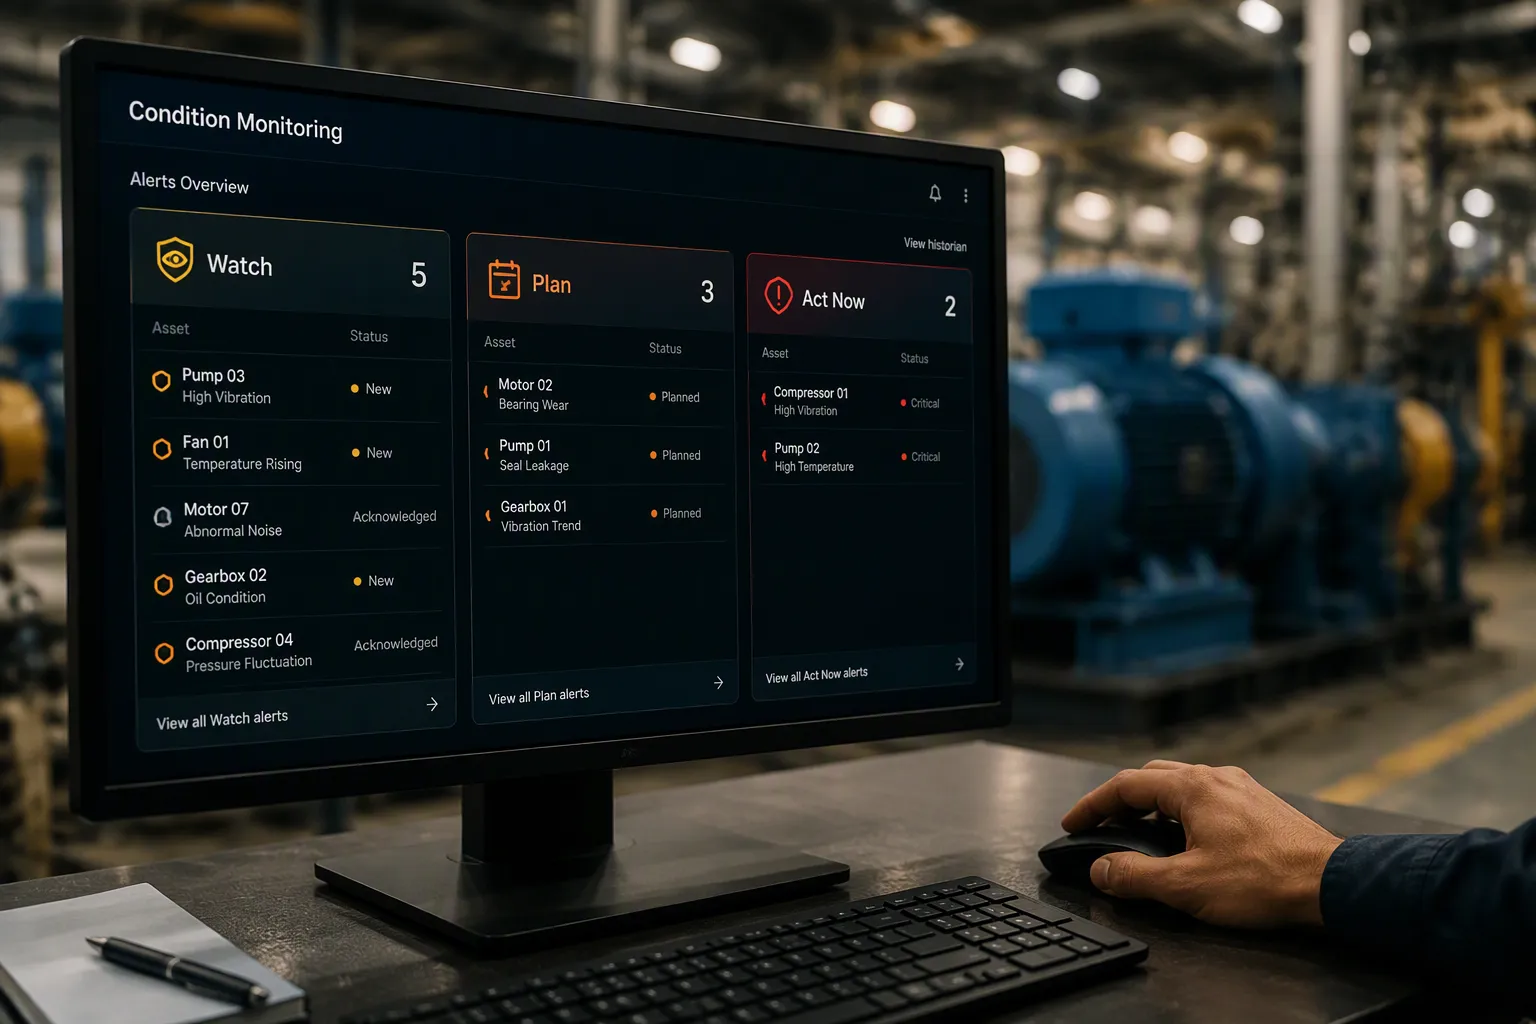
Alert design decides whether your team adopts the system or abandons it. A detection that never reaches the right person at the right time has no value. You must convert every meaningful signal into a clear next step.
Tiered Alerts by Asset Criticality
Not every alert deserves the same urgency. A tiered structure assigns different response rules to different severity levels. Your team then knows how to respond without making a fresh judgment call on every notification.
- Watch tier: A condition has drifted from baseline but is not yet actionable. Log it, set a review date, and re-check at the next scheduled opportunity.
- Plan tier: Genuine degradation requires attention before failure. Raise a planned work order in your CMMS and schedule it within the next maintenance window.
- Act now tier: Real and present risk to production, safety, or quality. The alert goes to a named person with authority to act, and response time is measured in hours, not days.
Each tier needs a clear threshold, a clear owner, and a clear response time. Review these quarterly with your team. Criticality-tiered thresholds tighten rules for Tier 1 assets and loosen them for non-critical ones. Multi-point pattern confirmation cuts false positives significantly. A Tier 1 alert fires only after multiple anomalous readings form a pattern.
False positives are not merely an inconvenience. They act as a cultural setback that dims confidence in digital transformation. When teams repeatedly see alerts that do not result in confirmed faults, they stop responding with urgency. That behavioral shift is very difficult to reverse.
Root Cause Hints and Dashboards
An alert without context is just a notification. Give technicians evidence, historical trend data, and a named owner. Then the alert becomes a decision-making tool. Prescriptive repair recommendations tell them what to do next, not just that something is wrong.
Dashboard design follows a few principles. Place the most essential metrics at the top for instant visibility. Use clear visualizations so trends and anomalies stand out. Ensure the interface loads in under 2 seconds and works on phones and tablets. Add filters and clickable charts so users can drill down. Collect user feedback regularly and refine the layout.
Tailor each view by role. A technician needs asset-level detail and repair steps. A reliability engineer needs fleet trends and failure patterns. A plant manager needs cost and downtime summaries. Structure the dashboard so data leads naturally to action. Use intuitive color schemes, adequate white space, and consistent visual cues.
Alert fatigue sets in when thresholds are too conservative or when every alert carries equal urgency. As real-time monitoring scales across more equipment, notification volume grows. Teams that cannot distinguish a minor drift from a genuine warning start ignoring both. Tiering stops the "everything is urgent" behavior. Integrations should remove admin work, not add it. Test whether a detected condition flows into a planned work order with less effort than doing it manually. If not, review the process.
A Phased Rollout Roadmap
Pilot, Benchmark, Expand
Start with a pilot on a small set of critical assets. Select a representative number to demonstrate value while keeping scope manageable. Pilot assets should represent typical operating conditions and provide clear success metrics. Run the pilot for a defined period. Apply anomaly detection to that asset class. Track emergency work orders, mean time between failures, and technician hours saved.
Benchmark accuracy and cost before you expand. A real-world example shows why this matters. A food processing plant invested in a vibration pilot on a small set of motors. Unplanned downtime dropped noticeably on those assets. However, when scaling to all assets without a scalable platform architecture, original gains eroded. Your industrial iot platform must handle growth from the start.
Expand in phases. Add machine classes and sensor types as the platform proves itself. Industry benchmarking sets targets for unplanned downtime reduction. Measurable downtime reduction typically appears within a short period after sensor go-live. A 12-month deployment outcome shows significant improvements in unplanned downtime, maintenance costs, and equipment lifespans.
Metrics That Prove ROI
Track four core metrics. Detection accuracy measures how often the system correctly identifies real faults. False alarm rate shows how many alerts are noise. Cost per machine reveals your scaling efficiency. Mean time to repair tracks how fast your team responds.
The machine condition monitoring market reached $3.37B in 2025 and is projected to hit $4.7B. This growth reflects industry momentum behind predictive maintenance. These metrics prove your condition monitoring at scale investment works.
You cannot scale condition monitoring with more analysts alone. Automation handles the volume. Architecture and data pipeline choices decide your cost. Smart alerting protects your team from fatigue.
Treat the rollout as an iterative process. Start with a pilot on critical equipment. Benchmark accuracy and cost. Then expand in phases as the platform proves itself.
Your system should improve over time. More data and feedback refine the models. Each new insight sharpens detection. That cycle lifts predictive maintenance results and your overall operational performance. Strong maintenance and predictive practices follow.
FAQ
How many machines should I start with?
Begin with a small set of critical assets. This scope stays manageable and still proves value. Run the pilot for a defined period. Track emergency work orders, mean time between failures, and technician hours saved. Benchmark accuracy and cost before you expand to more machine classes.
How much does edge preprocessing reduce my data volume?
Edge gateways apply filtering and Fast Fourier Transforms locally. This cuts the data sent to the cloud by about 70% compared to raw transmission. Bandwidth savings reach 60% versus cloud-only processing. Latency also drops by 35%. You move less data and pay less for storage.
What compression can I expect for vibration data?
Columnar time-series storage with efficient encoding can significantly reduce storage requirements.
How do I stop false alarms from eroding trust?
Use tiered alerts tied to asset criticality. Multi-point pattern confirmation significantly cuts false positives. A Tier 1 alert fires only after multiple anomalous readings form a pattern. Reported outcomes include high alert response rates.
What metrics prove my rollout works?
Track four core metrics: detection accuracy, false alarm rate, cost per machine, and mean time to repair. The machine condition monitoring market reached $3.37B in 2025.
See Also
Impress Your Buyers Using Intelligent Machine Learning Order Systems
Utilizing Data Analytics to Sense Demand in Drop Business Models
The Transformative Impact of Dynamic Slotting on Warehouse Operations
Artificial Intelligence Powered Capacity Planning Strategies for Modern Brands