
You have spent a year dropshipping. Sales look steady, but your margins feel painfully thin. Each order passes through a supplier you cannot control, and customer complaints about shipping delays keep piling up. You wonder if buying owned inventory might fix these problems.
Should you stay lean with dropshipping, or invest in owned inventory to protect quality and profit? The wrong choice can stall your ecommerce store's growth or drain your cash flow. This is where AI tips the scale. AI tools can analyze your sales velocity, supplier reliability, and customer feedback. They give you a data-driven answer to decide between dropshipping and inventory. This post offers a practical framework for your ecommerce business, using AI as your guide through the online marketplace. You will learn to weigh costs, risks, and control with confidence.
Risk vs. Control: The Core Trade-Off
Every ecommerce founder faces the same fork in the road. You can keep your operation lean with dropshipping without inventory, or you can commit capital to owned inventory. Each path carries distinct risks and rewards. Understanding this trade-off helps you make a smarter choice for your business.
Dropshipping's Profit Paradox
The dropshipping model looks attractive because it removes upfront costs. You pay for products only after a customer places an order. This flexibility protects your cash flow. However, the numbers reveal a different story. Your gross margin might reach 65-70% before expenses. Yet net profit often falls to just 15-25% after you account for advertising, shipping, and platform fees. Many Shopify stores see net profits between 10-20%. Individual products typically yield only 20-30% profit.
| Metric | Target Value | Description |
|---|---|---|
| Gross Margin | 65-70% | Ideal gross margin before expenses |
| Net Margin | 15-25% | Profit after all costs (COGS, ads, shipping, fees) |
| Shopify Net Profit | 10-20% | Typical net profit for Shopify dropshipping stores |
| Per Product Profit | 20-30% | Rule of thumb for individual product margin |
These thin margins create the paradox. You avoid inventory costs, but you sacrifice profitability per sale. Hidden costs also appear. Supplier delays damage your reputation. Quality issues trigger returns. You cannot inspect products before they reach your customers. The dropshipping model limits your control over the entire customer experience.
Holding Inventory's Control Advantage
Owned inventory demands more capital, but it grants you control. You can inspect every product before sale. This quality check reduces returns and negative feedback. Your fulfillment process becomes faster and more reliable.
- Having products in stock ensures orders ship quickly, preventing stockouts and backorders.
- Well-organized inventory enables fast shipping from your warehouse.
- Stocking seasonal products captures sales when demand peaks.
- Sufficient inventory allows quick exchanges for damaged items.
Better Quality Control: Holding inventory also allows businesses to inspect products before they are sold, ensuring that they meet quality standards and reducing the risk of returns or negative customer feedback.
Consider a brand that switched from dropshipping to owned inventory. They fixed chronic shipping delays by storing products locally. Delivery times dropped from two weeks to three days. Customer satisfaction soared. The investment in inventory paid for itself through repeat orders.
The trade-off between dropshipping vs inventory ultimately comes down to your priorities. Dropshipping offers flexibility and low risk. Holding inventory offers control and higher margins. Your choice depends on your goals, your cash reserves, and your tolerance for risk.
The Scalability Breakpoint

Every ecommerce business reaches a moment when the numbers start talking. You notice that your dropshipping operation handles 50 orders a day, but each one carries the same supplier delays and thin margins. The question becomes: when does holding inventory actually cost less than the margin loss you absorb with every dropshipped sale? This is the heart of the dropshipping vs inventory decision.
When Dropshipping Hits Its Ceiling
Dropshipping works beautifully at low volume. You avoid storage costs, you pay for products only after customers order, and you can test new items without risk. But as your order count climbs, the cracks begin to show.
Supplier processing time becomes your first bottleneck. In traditional dropshipping, each order travels to the supplier first, which can take 3–4 days before the product even reaches the fulfillment warehouse. When you ship 10 orders a day, those extra days barely register. When you ship 100 orders a day, they become a wall between you and customer satisfaction.
Other scalability issues compound the problem. Suppliers list products as available even when stock runs low, leading to canceled orders and frustrated buyers. Product quality varies between batches, driving up return rates. Communication problems with suppliers slow your response to customer complaints. Unclear return policies force you to absorb costs for damaged items. Each of these issues multiplies with volume, eating into your profitability and scalability.
Your profit shrinks further as you spend more on customer service and dispute resolution. The 20-30% per-product profit you enjoyed at 20 orders a day might drop to 10% at 200 orders a day. That is the ceiling. Beyond this point, every additional order adds complexity without adding proportional profit.
When Holding Inventory Pays Off
Holding inventory flips the equation. You invest capital upfront, but you gain speed, quality control, and consistent margins. The key is knowing when the switch makes financial sense.
The breakpoint is the sales volume where your total cost of holding inventory becomes lower than the cumulative margin loss from dropshipping. You can estimate your own breakpoint with a simple heuristic:
- Calculate your average margin loss per dropshipped order (your target margin minus your actual margin).
- Multiply that by your monthly order volume to get your monthly margin loss.
- Estimate your annual carrying cost for inventory, which typically runs 20-30% of inventory value for multichannel ecommerce businesses.
- Divide your annual carrying cost by 12 to get a monthly figure.
- When your monthly margin loss exceeds your monthly carrying cost, you have found your breakpoint.
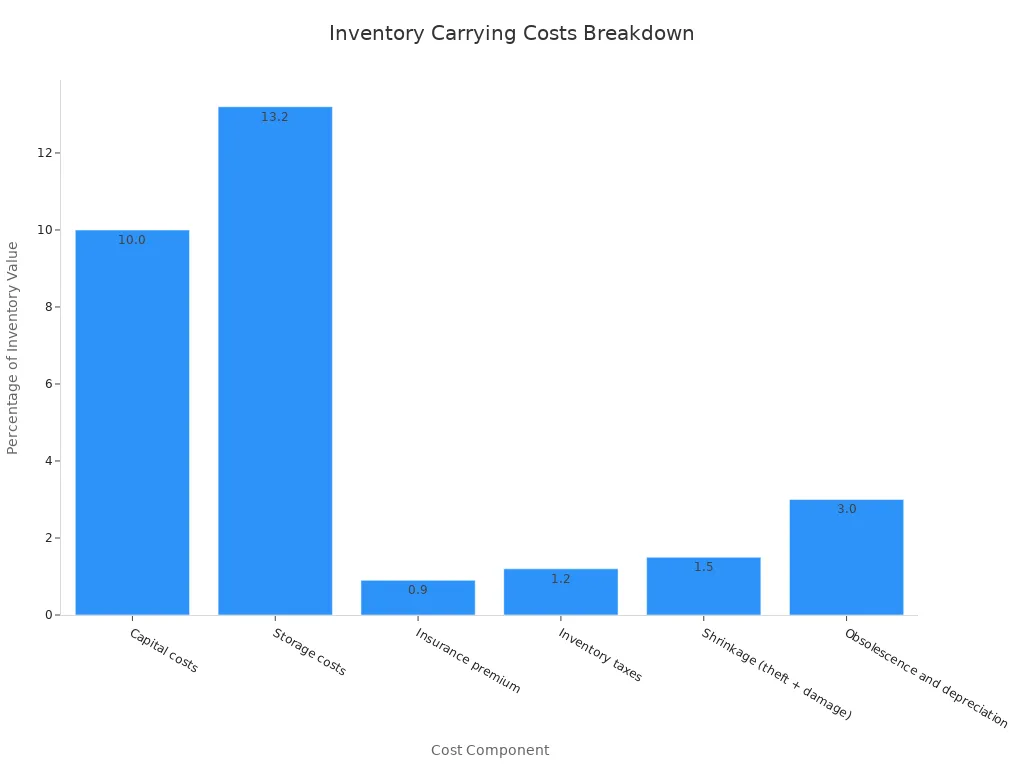
For example, suppose you lose $5 per order to dropshipping inefficiencies. At 500 orders per month, that is $2,500 in monthly margin loss. If holding $100,000 of inventory costs you $30,000 annually (or $2,500 monthly), you have hit your breakpoint exactly. Beyond that volume, owned inventory becomes the cheaper option. You gain control over quality, speed, and customer experience.
The smartest strategy is to start with dropshipping without inventory, validate demand, then transition your best-selling products to owned inventory. This approach lets you test the market with minimal risk, then commit capital only when the data supports it. You avoid stockouts, reduce shipping times, and protect your profit as you scale. Your operating expenses stay predictable because you control the fulfillment process. Your shipping costs become stable and reliable.
The breakpoint is not a fixed number. It shifts with your product mix, your supplier relationships, and your storage costs. But calculating it gives you a concrete target. You stop guessing and start planning. For many sellers, owned inventory represents the natural next step after they cross this threshold.
How AI Tips the Scale for Ecommerce Decisions

You now understand the trade-off and the breakpoint. The next question is practical: how do you know which products deserve owned inventory and which should stay with dropshipping? This is where AI tips the scale. AI tools turn raw sales data into clear guidance. They remove guesswork from your ecommerce strategy. You can finally see which path leads to better profitability.
Demand Forecasting: Predicting the Unpredictable
Forecasting demand feels like reading tea leaves. You might guess that winter coats sell in November. But what about that unexpected heatwave in October? AI solves this problem by analyzing patterns you cannot see manually.
AI tools pull data from many sources. They examine historical sales records, market trends, competitor pricing strategies, website traffic patterns, and customer behavior insights. They also factor in social media trends, weather forecasts, and upcoming events. The model integrates real-time sales trends with marketing inputs to predict unit demand and revenue over 30, 60, and 90-day horizons.
The accuracy difference is striking. Traditional averages produce a Mean Absolute Percentage Error (MAPE) of 35–45%. AI models typically achieve 8–15% MAPE. In supply-chain practice, a MAPE of 10–20% is considered workable. Bias, tracked alongside MAPE, should stay within ±5% to show both magnitude and direction of error.
| Model Type | Mean Absolute Percentage Error (MAPE) |
|---|---|
| AI models | 8–15% |
| Traditional averages | 35–45% |
AWS reported that its 2022 cold-start overhaul produced forecasts up to 45% more accurate for new products. This matters for your business because new products carry the most risk. You do not know if they will sell. AI reduces that uncertainty.
However, forecasting is a data problem before it is an AI problem. A machine-learning model trained on six months of clean, well-attributed sales history will reliably beat a spreadsheet. The same model trained on sparse, mislabelled, or promo-contaminated data will confidently produce worse numbers than an honest moving average. The sophistication of the model cannot compensate for the quality of the history it learns from.
A model tuned to fit history perfectly often forecasts the future worse. More parameters and more agents can add complexity that looks rigorous but fails the only test that matters: beating a naive baseline out of sample.
Forecast Value Added (FVA) asks whether each step in your pipeline actually reduces error versus a naive baseline like last-period-equals-next. Without it, organizations pile on complexity that looks sophisticated but does not measurably improve accuracy. You should apply this same test to your own forecasting tools.
Accurate forecasting reduces stockouts and minimizes overstocking. You replenish inventory at the right time. You avoid purchasing more stock than necessary. This improves cash flow and frees resources for other areas. For dropshipping vs inventory decisions, this accuracy tells you which products deserve the capital commitment of owned inventory.
Real-Time Margin Analysis Per SKU
Demand forecasting tells you what will sell. Margin analysis tells you what is worth selling. Many sellers think they know their margins. They look at the sale price, subtract the product cost, and call it profit. This view misses hidden costs.
AI calculates true profitability per SKU by factoring in every expense. The table below shows the full breakdown:
| Step | Metric | Amount |
|---|---|---|
| 1 | Product price | $50.00 |
| 2 | COGS | -$15.00 |
| 3 | Gross margin | $35.00 |
| 4 | Marketplace & payment fees (18%) | -$9.00 |
| 5 | Shipping & fulfillment | -$8.50 |
| 6 | Marketing cost | -$7.00 |
| 7 | Cost of returns (30% × $15) | -$4.50 |
| 8 | True net profit per sale | $6.00 |
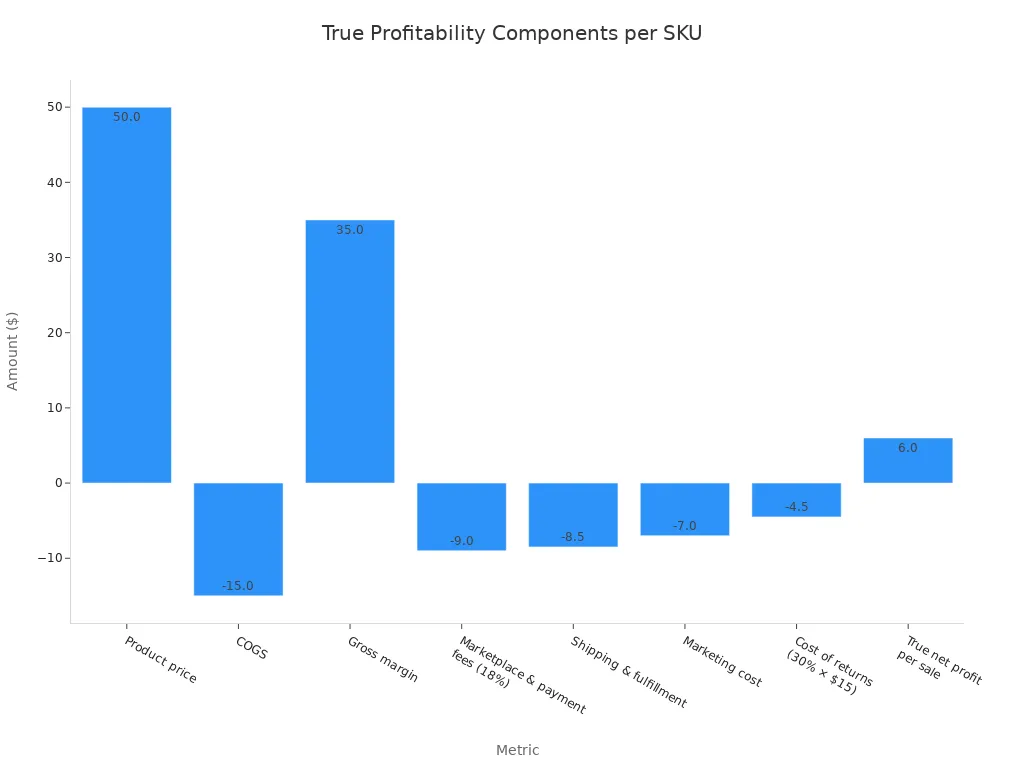
The components include landed COGS (manufacturer price plus freight, duties, taxes, and customs fees), marketplace and payment fees, fulfillment and shipping costs, returns and damages, attributed marketing cost, and inventory carrying costs. Carrying costs alone run 20–35% of inventory value.
Return rates vary significantly by SKU. A sizing-dependent apparel SKU may see 28% returns while an accessory SKU from the same brand sits at 6%. The fully loaded cost per return is $28: $7 outbound shipping, $6.80 return label, $5.50 3PL processing and inspection, and $8.70 in product write-down. A supplements brand with one SKU having a 22% return rate and 800 returns per month absorbs $22,400 in monthly costs hidden in a single "returns" line.
AI benchmarks contribution margin against category-specific targets. Beauty and skincare targets 25–35% contribution margin. Fashion and apparel targets only 10–20% because high return rates destroy margins. Electronics and gadgets target 8–18% due to intense price competition. When margins drift below thresholds, AI surfaces the specific cost driver so you can take corrective action immediately.
This analysis reveals which products erode your profitability. You stop relying on blended averages. You see the truth per SKU. This clarity guides your owned inventory investments toward products with genuine margin strength.
Weighing Dropshipping vs. Holding Inventory: A Hybrid Approach
You do not have to choose one model exclusively. Many successful ecommerce business owners use a hybrid approach. They hold inventory for their best products. They use dropshipping for experimental items. This strategy gives you the best of both worlds. You protect margins on your top sellers. You keep flexibility for testing new products. The approach represents a practical way of weighing dropshipping vs. holding inventory as a continuous decision. Holding inventory for hero SKUs protects your margins while dropshipping manages risk.
A hybrid model offers several advantages. You gain more control over sales across channels. You build better customer trust through reliable fulfillment. You create a stronger brand presence. You collect more insights from both inventory and dropshipping data. You leave room to grow without taking large risks. You scale inventory up or down based on seasonal demand. Your shipping speeds improve for products you stock locally. Your costs become more predictable. Your business gains flexibility and control.
Core Hero SKUs vs. Long-Tail Experimentation
The key to a hybrid model is knowing which products to hold and which to dropship. You need to identify your hero SKUs. A hero SKU combines high sales volume with stable profitability. It becomes the face of your store. It drives consistent revenue and builds customer trust. These products justify the capital commitment of owned inventory.
How do you find your hero SKUs? Start with your sales data. Look beyond total revenue. Examine unit sales volume, repeat purchase rates, and customer retention impact. A product with steady performance over time deserves more attention than a SKU with a temporary spike. Your hero SKU should have a strong visual identity. It should appeal to multiple customer segments. It must have reliable production with consistent quality. It should maintain healthy profit. These criteria help you separate true heroes from traffic SKUs that sell well but generate low profit.
For long-tail products, dropshipping without inventory works perfectly. These items have lower volume. They serve niche customer needs. You test them with minimal risk. If they show early positive signals, you can consider moving them to owned inventory later.
Dynamic Switching with AI Assistance
AI makes the hybrid model even more powerful. It enables dynamic switching between dropshipping and owned inventory. When a SKU hits a profit threshold, AI can recommend moving it to owned inventory. When margins drop below a certain point, AI can suggest moving it back to dropshipping. This continuous optimization keeps your inventory aligned with market conditions.
This dynamic switching removes guesswork. You set the rules. AI monitors the data continuously. It tracks sales velocity, margins, and costs per SKU. It factors in fulfillment expenses and shipping costs. It analyzes return rates and supplier performance. When conditions change, AI alerts you. You can take action immediately. You never overcommit capital to underperforming products. You never miss opportunities on rising stars.
The result is a flexible system that adapts to real-time data. Your inventory decisions become data-driven and timely. Your customers receive better service because you stock the right products at the right time.
Your AI-Driven Implementation Roadmap
You have the framework. Now you need a plan. This roadmap guides you from data to decision. You will identify your best products, test them with a trial run, and scale with confidence. The process removes guesswork from your ecommerce strategy.
Step 1: Audit Your Data and Identify Hero SKUs
Start by exporting your sales data. Look for products with high sales volume and strong margin contribution. AI tools can rank SKUs by combining these two metrics. For example, a platform might show SKU-001 with 1,250 units, 8.2 turnover, and 32% margin. That product earns a high rating. Another SKU might have 320 units and 15% margin. This analysis reveals your true top performers. You can also identify hidden gems. These products may not lead in volume but serve high-value customer segments. They boost profitability without large sales numbers.
Assess your current pain points. Identify where AI can resolve issues like stockouts. Clean and structure your data before feeding it into an AI tool. Accurate inputs lead to reliable forecasts. The goal is to find products worthy of owned inventory. A hero SKU combines volume, margin, and consistent demand. It justifies the capital commitment. AI also reveals hidden expenses like return processing costs, giving you a clearer picture of true business expenses. This step ensures you understand your full cost structure before committing to owned inventory.
Step 2: Pilot, Measure, and Scale with Confidence
Select one or two hero SKUs for your pilot. Buy owned inventory for these products. Continue dropshipping the rest of your catalog. Run the pilot for 30 days. Compare the performance of these SKUs against their dropshipping equivalents.
Track key metrics. Measure margin, delivery time, return rate, and support interactions. These numbers tell you if this approach improves your operation. Watch for stockouts. Compare shipping costs. Expect faster shipping times for owned inventory products. Monitor stock accuracy. Track carrying costs to understand the expense of holding inventory.
Be aware of common pitfalls. Data quality issues can corrupt your results. Ensure your POS and ERP systems provide accurate data. Integration challenges with legacy systems can create bottlenecks. Manage change within your team. Your staff must adapt to AI-assisted workflows. Train them on interpreting AI outputs. Finance and operations teams need to understand when AI recommendations conflict with established practices.
After 30 days, analyze the data. If the pilot SKU shows higher margins, faster delivery, and lower return rates, scale up. Add more hero SKUs to owned inventory. If the results are mixed, revisit your data. The pilot gives you a safe space to learn. You scale with confidence because the numbers back your decision.
AI tips the scale by revealing the optimal path for your specific business data. You do not need to guess between dropshipping and holding inventory. Use AI to forecast demand, analyze margins, and find your scalability breakpoint. This approach reduces storage costs and improves customer satisfaction for your business. Start small with owned inventory. Run a pilot on one owned inventory SKU rather than making a wholesale switch. Let AI tips the scale for your decision. Review your inventory data closely. This simple test builds confidence through facts. It shows you the numbers you need. Stop guessing. Let your data guide your ways to grow your business.
FAQ
How do I know when to switch from dropshipping to owned inventory?
Calculate your breakpoint. Compare your monthly margin loss from dropshipping against your monthly carrying cost for inventory. When margin loss exceeds carrying cost, owned inventory becomes the cheaper option. AI tools can track these numbers automatically for you.
What is the best way to test owned inventory without big risk?
Start with one hero SKU. Buy a small batch of that product. Run a 30-day pilot. Compare margins, delivery times, and return rates against your dropshipped products. The data will show you whether the switch makes sense before you commit more capital.
Can AI really predict which products will sell well?
Yes. AI models achieve 8–15% Mean Absolute Percentage Error in demand forecasting, compared to 35–45% for traditional averages. These tools analyze historical sales, seasonality, and market trends. They help you avoid overstocking and stockouts with greater accuracy.
Should I use both dropshipping and owned inventory at the same time?
Many successful sellers use a hybrid model. Hold inventory for high-volume hero SKUs. Use dropshipping for long-tail experimental products. AI can monitor performance and suggest when to move a product from one model to the other based on profitability thresholds.
What hidden costs should I track when comparing these models?
Track return rates, shipping fees, and carrying costs. A single return can cost $28 when you factor in outbound shipping, return labels, and processing. AI margin analysis reveals these hidden expenses per SKU, giving you a true picture of profitability.
See Also
Essential Strategies For Smooth Warehouse Stock Movement
Mastering Blind Shipping To Boost Online Retail Growth
Optimizing Operations Through Intelligent Ecommerce Warehouse Tactics
Emerging B2C Fulfillment Trends Accelerating Quicker Shipping