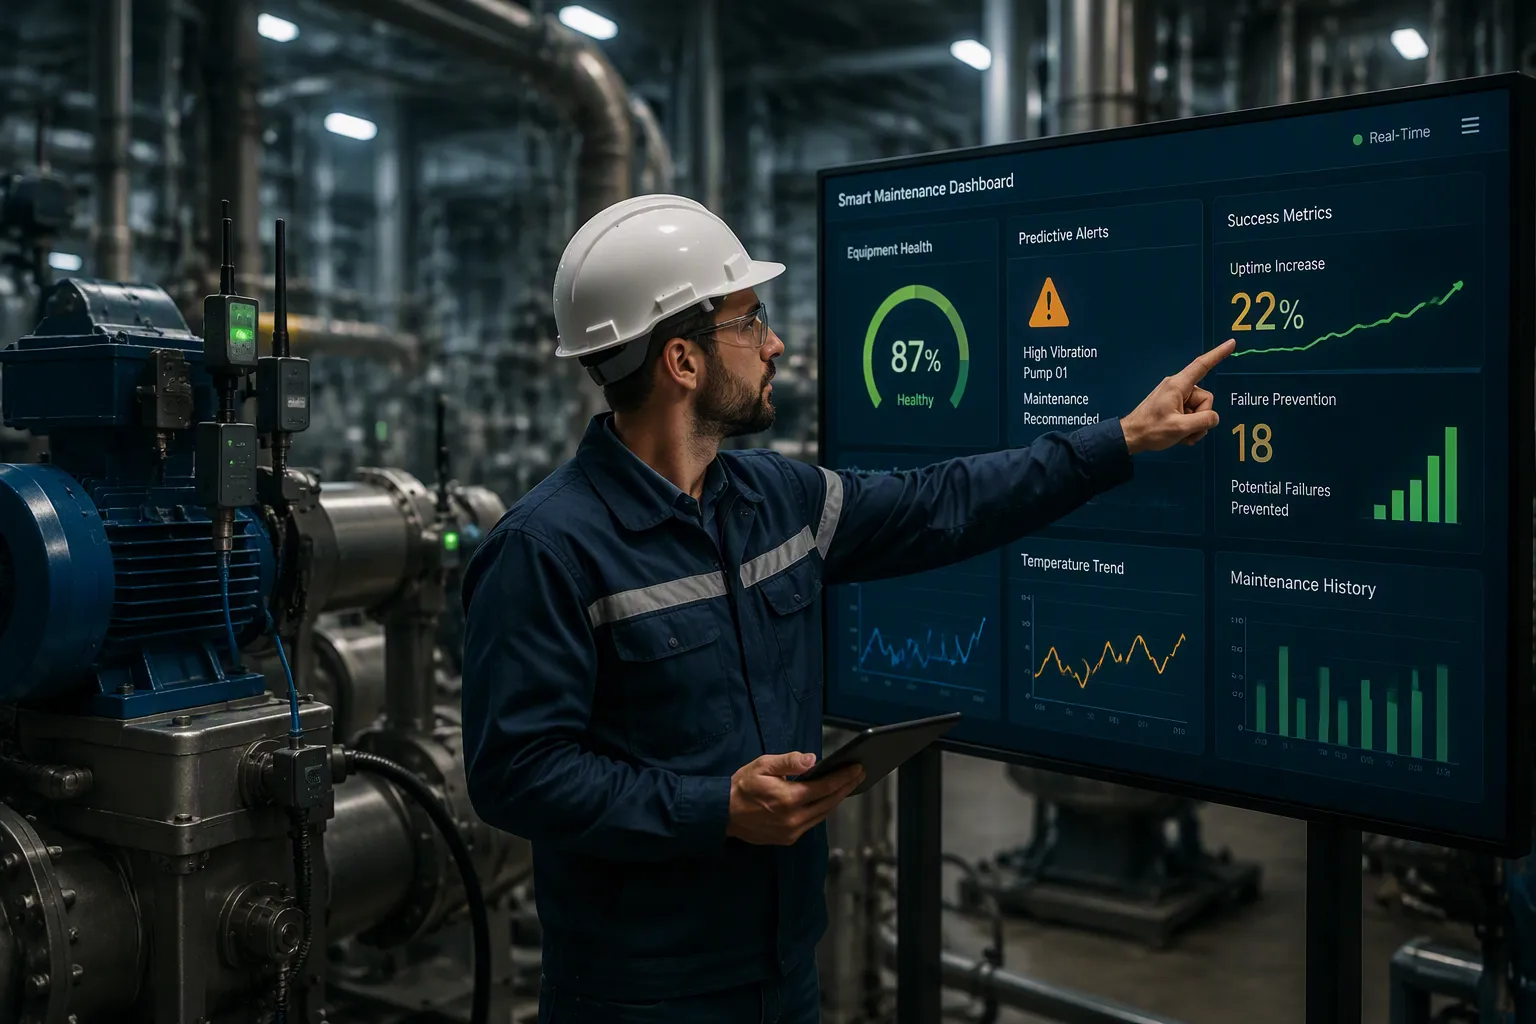
Unplanned downtime drains roughly $1.4 trillion from global industry every year, according to Siemens. That number should make you rethink how you protect your machines. Success with predictive maintenance depends on a multi-sensor, context-aware approach, not one sensor type alone. You need vibration, temperature, and current data working together. Each signal covers gaps the others miss. So how do you build iot equipment monitoring without blind spots and still prove measurable ROI? This guide answers that question with a structured plan. You will learn which sensors matter, why single-signal setups fail, and how to turn raw data into real savings.
Core Sensors for IoT Equipment Monitoring

You cannot protect a machine you cannot feel. Condition monitoring means watching a machine's vital signs continuously so you spot change before failure. Predictive maintenance takes that data and tells you when to act. Together they form the backbone of any iot equipment monitoring program. Three signal families do most of the work: vibration, temperature, and current.
Vibration: The Mechanical Health Signal
Wireless vibration sensors measure mechanical movement many times per second. They often capture temperature as a second parameter in the same housing. These devices track vibration levels, frequency content, and thermal shifts, then send readings wirelessly to an IoT platform for analysis. Industrial wireless vibration temperature sensors commonly use 16-bit sensing for both vibration and temperature, which delivers highly accurate data. Surface temperature sensors built into multi-modal vibration devices provide continuous monitoring of bearing housing temperature.
Vibration signatures map to specific faults. A dominant peak at 1× running speed points to rotor imbalance. Peaks at 2× or 3× running speed suggest misalignment. High-frequency impacting signals bearing defect frequencies. Gear mesh frequency sidebands reveal tooth deterioration. Your vibration monitoring program reads these patterns to name the fault, not just flag noise.
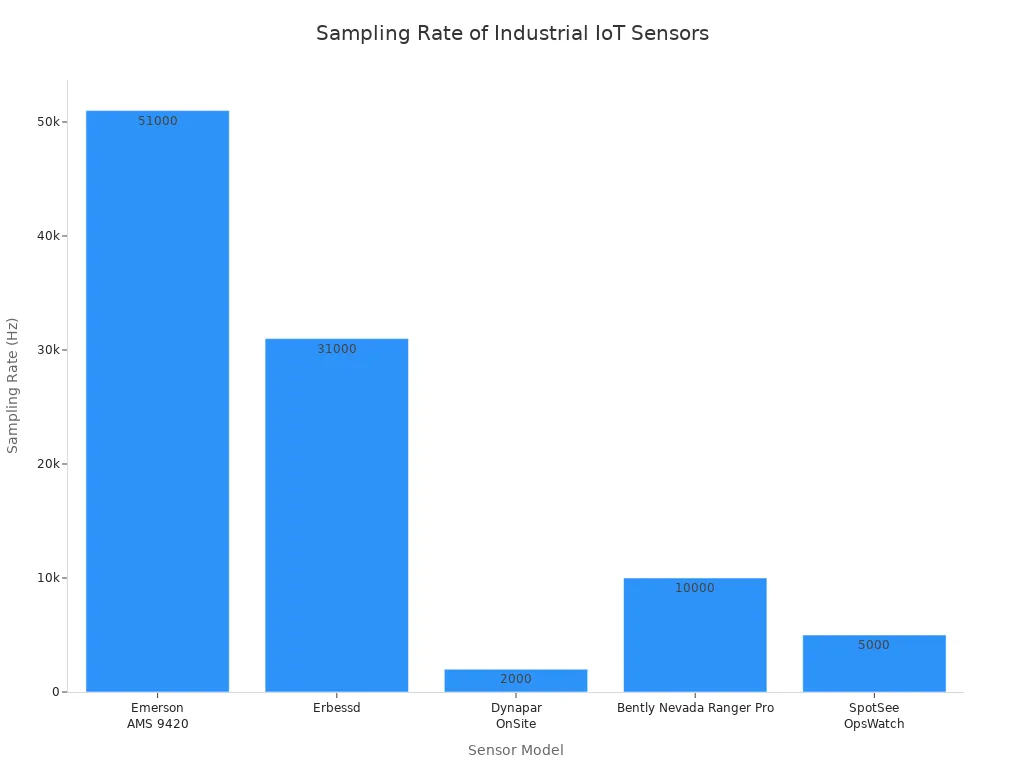
| Sensor Model | Accuracy / Sensor | Sampling Rate | Frequency Range |
|---|---|---|---|
| Emerson AMS 9420 | Piezoelectric single-axis accelerometer, 80g range | Up to 51 kHz | Rotor vibration: 2–65 Hz; Rotor harmonics: 65–300 Hz; High frequency: 300–1,000 Hz |
| Erbessd | Connects to ICP piezoelectric accelerometers; includes internal temperature | Up to 31 kHz | Not specified |
| Dynapar OnSite | Triaxial accelerometers with temperature sensor | Up to 2,000 Hz | 0–1,000 Hz |
| Bently Nevada Ranger Pro | 20g accelerometer | Up to 10,000 Hz | Not specified |
| SpotSee OpsWatch | Triaxial accelerometer, 200g range | Up to 5 kHz | Not specified |
Temperature and Current: Thermal and Electrical Health
Temperature sensors catch what vibration misses. A bearing can run hot from lubrication breakdown, overload, or friction long before it shakes itself apart. Thermal sensors watch winding temperatures, bearing housings, and process fluids. Current and power sensors read the electrical side of the machine. Motor current signature analysis detects rotor bar cracks, air gap eccentricity, and stator winding shorts weeks before they show up in thermal scans. Electrical and magnetic field sensors extend that reach to transformers and switchgear. Ultrasonic sensors add another layer by hearing compressed air leaks and early bearing distress that vibration sensors may not resolve.
The data path is straightforward. A sensor detects a physical property, converts it to an electrical signal, processes it onboard, and transmits it to a gateway or cloud platform. From there, analytics compare readings against baselines and trigger alerts. This pipeline turns raw measurements into maintenance decisions.
Why Single-Sensor Monitoring Fails
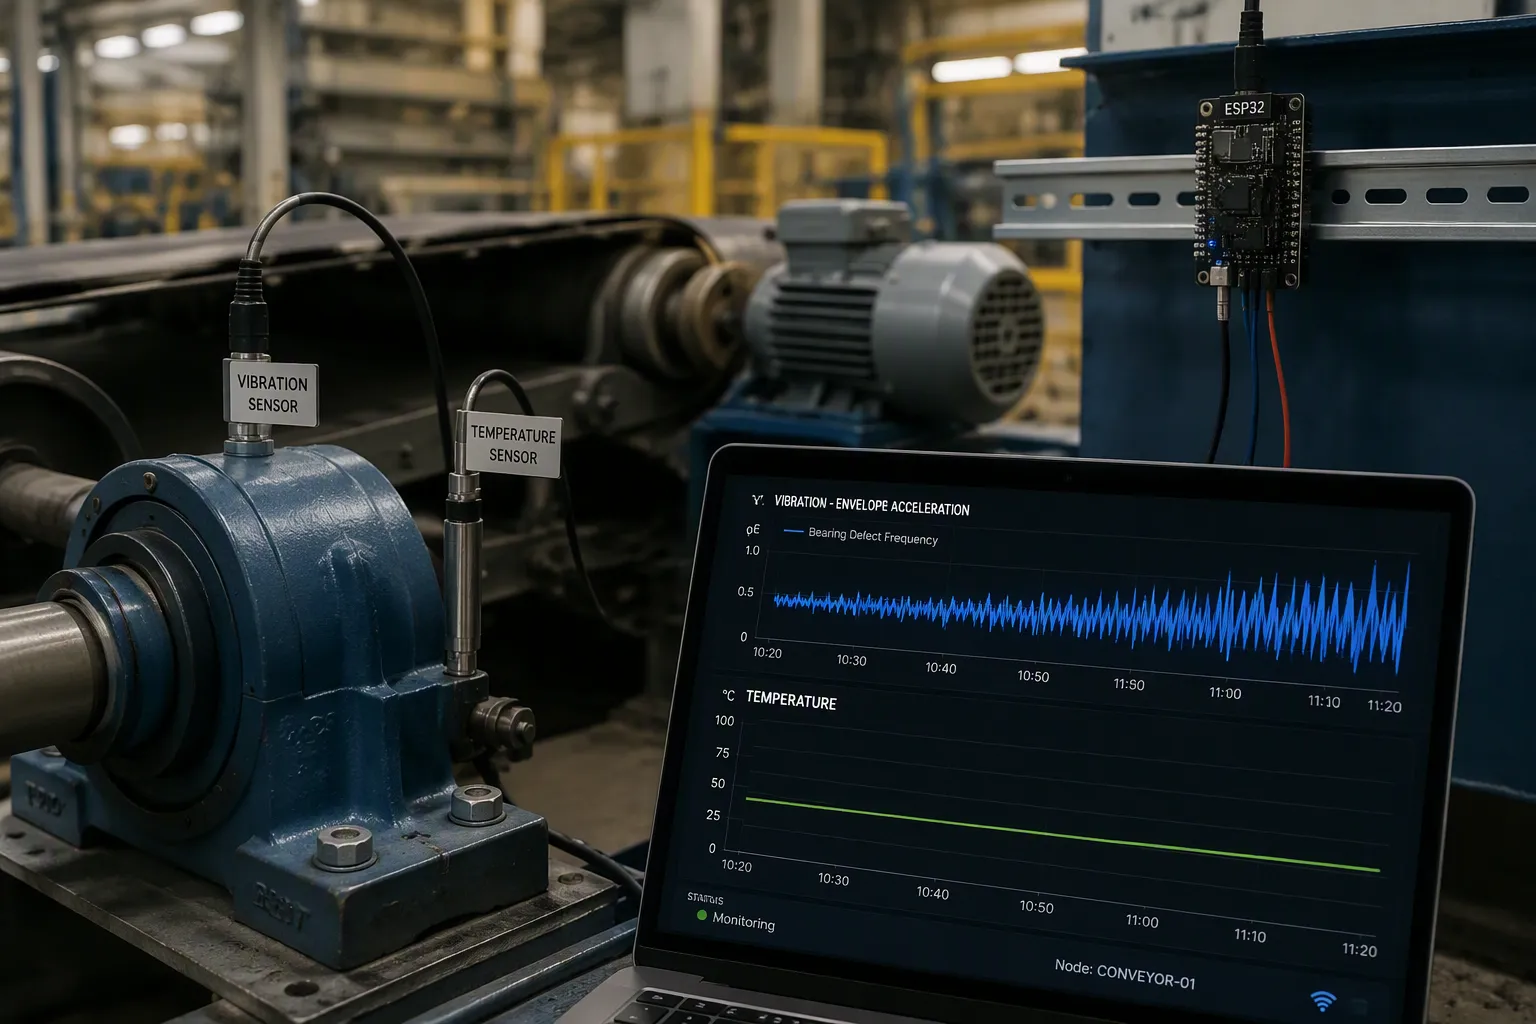
One signal never tells the whole story. Picture a mid-size bearing on a conveyor drive. A vibration sensor picks up a rising high-frequency impact pattern at the bearing defect frequency. The temperature reading stays flat for weeks. Nothing looks wrong on the thermal trend. Then the bearing seizes, the line stops, and the repair bill lands. The fault was visible the entire time, but only through one window. A single-sensor setup gives you a narrow view of a machine that fails in many ways.
Blind Spots That Lead to Missed Failures
Every sensor type has a blind spot. Vibration sensors excel at mechanical faults, yet they struggle with slow thermal drift and electrical degradation. Temperature sensors catch overheating, but they react late to early bearing defects. A current sensor sees electrical problems, while ultrasonic sensors hear leaks and friction that other devices miss. Rely on one device and you inherit its blind spot as your own.
An IoT-based real-time vibration and temperature monitoring system solves this by design. You can integrate multiple vibration sensors and temperature sensors into a single ESP32 node for synchronized monitoring. Each node samples every channel on the same clock, so readings line up in time. That timing matters. A temperature rise that follows a vibration spike tells a different story than a temperature rise on its own. Synchronized sampling makes that sequence visible.
The Case for Multimodal Coverage
Condition monitoring iot deployments must combine signals to avoid coverage gaps. One device confirms what another suspects. Vibration flags a defect, temperature confirms friction, and current reveals the electrical strain behind it. This multi-sensor correlation turns three weak clues into one strong conclusion. It also sharpens failure mode diagnosis, because each fault type leaves a distinct fingerprint across the signal set.
The payoff shows up in your alert quality. A lone vibration threshold fires on normal load changes and floods your team with noise. Add temperature and current, and the same event looks ordinary. The system stays quiet. When all three signals move together in an unusual pattern, you get an alert worth acting on.
Coverage also protects against sensor failure itself. If one device drops offline or drifts, the remaining signals still describe machine health. Your condition monitoring program keeps running instead of going dark. That redundancy costs less than one unplanned outage.
A practical deployment starts small. Instrument one critical asset with vibration, temperature, and current sensing on a shared node. Watch how the signals behave together for a few weeks. You will see patterns that no single reading ever revealed. That first asset teaches you what multimodal coverage means for the rest of your fleet. From there, you can scale the same approach to every machine that matters, and your predictive maintenance program rests on evidence instead of guesswork.
Adding Context with Condition Monitoring IoT
A vibration reading alone cannot tell you why a machine shakes. Deploying IoT sensors for real-time equipment monitoring lets you track vibration, temperature, pressure, and more for condition-based maintenance. This wider view separates a normal load change from a developing fault.
Process Sensors as the Context Layer
Process sensors such as pressure, flow, and shaft speed do not measure asset health directly. They capture the operating environment that gives a vibration signal its meaning. A vibration spike on a centrifugal pump could point to mechanical looseness or to a shift in flow conditions. Only the flow and pressure context can tell the two apart. Real-time RPM data matters just as much for rotating equipment. Without it, fault frequencies shift as speed changes, and analysis becomes unreliable on variable-speed assets. Fluid and oil condition sensors add another layer by revealing contamination or wear particles in lubricants. Together, these devices turn an ambiguous alert into a confident diagnosis.
From Noisy Alerts to Trusted Insights
Raw signals carry noise, drift, and outliers. Sensor readings must stay consistent, precise, and noise-free to detect degradation trends accurately. Minor errors in vibration, temperature, or pressure signals can trigger false positives or hide real failures. Outlier detection, calibration checks, filtering, and normalization keep raw streams honest before they reach any predictive algorithm. Clean data strengthens every model downstream.
Algorithm choice matters too. Research shows machine learning and deep learning systems often beat fixed-threshold rules in fault-recognition accuracy and false-alarm reduction. You can also adopt proven practices:
- Tiered confidence alerts route low-confidence flags to investigation and reserve high-confidence alerts for mandatory action.
- Multi-sensor corroboration requires cross-validation before triggering costly interventions.
- Alarm rationalization removes any alert without a defined response.
- Actionable playbooks attach recommended action, priority, and context to each alert.
This integration builds trust. Your team stops chasing noise and starts acting on real problems.
Smart Equipment Monitoring Deployment Strategy
You cannot instrument every asset on day one. The 80/20 rule applies here: roughly 20% of assets cause 80% of downtime and cost. Your job is to find that 20% first. Industrial IoT sensors play a crucial role in predictive maintenance by continuously monitoring the vital signs of machines, including vibration and temperature. That power only pays off when you point it at the right equipment.
Prioritizing Assets by Criticality
Rank every asset by criticality, failure impact, and repair cost. A risk matrix maps probability of failure against consequence of failure, so you can spot high-priority assets fast. A simple criticality score multiplies consequence by likelihood. Consequence covers safety, environment, production, quality, and cost. This approach follows SMRP Best Practices, ISO 55000, and ISO 31000.
Use the score to set your sensor deployment priority. The table below shows how each tier earns a different strategy.
| Asset Priority Tier | Criteria | Sensor Strategy | Expected Outcome |
|---|---|---|---|
| Tier 1 — Critical | Single point of failure, no redundancy, high hourly downtime cost | Full multi-sensor suite: vibration, thermal, current, acoustic, pressure | Prevents highest-cost failures — fastest ROI payback |
| Tier 2 — Important | High utilization, moderate failure cost, some redundancy | Core sensor pair: vibration + temperature minimum | Catches most failure modes — good coverage-to-cost ratio |
| Tier 3 — Standard | Lower utilization, quick replacement, low downtime cost | Temperature + current monitoring for efficiency tracking | Energy savings and condition-based service scheduling |
| Tier 4 — Low Risk | Easily replaced, minimal production impact, low value | Run-to-failure or periodic manual inspection | Sensor investment not justified |
Scaling Coverage Without Breaking the Budget
Start small and prove value. Instrument 20–50 sensors on your top 20% of assets by failure cost. A typical campus reaches about 75% of failure risk and 60% of the maintenance budget by covering roughly 150–400 critical assets. Phase two adds building automation controllers, fire suppression, and plumbing only after baseline analytics mature.
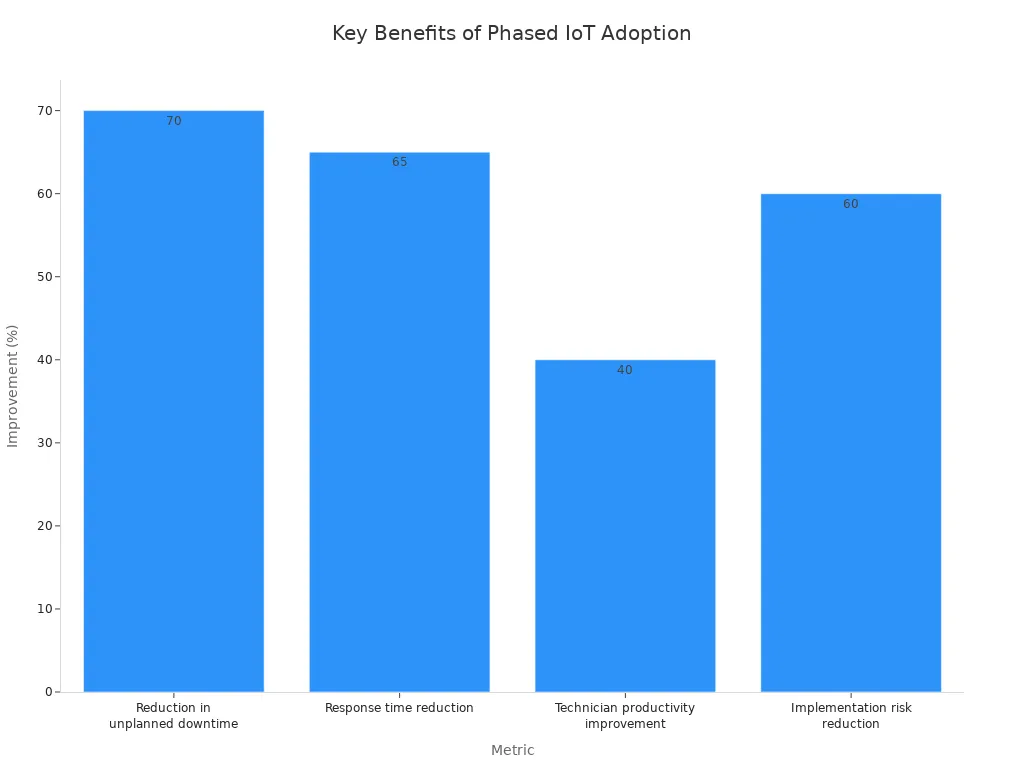
Multi-sensor accuracy reaches 92%, against 78% for single-sensor monitoring. That gap is the threshold where autonomous work order generation becomes reliable. Full sensor deployment ROI typically arrives within 90 days, often from one prevented failure on a critical asset. This phased path delivers 60–70% of benefits in the first 90 days. Your optimization work then shifts from installation to tuning alerts and expanding coverage.
The IoT-to-CMMS Pipeline
A reading only matters when it reaches the right person at the right time. A computerized maintenance management system (CMMS) is the software that stores asset records, schedules work, and tracks repairs. Your iot equipment monitoring program needs a clean path into that system. IoT sensors for predictive maintenance enable real-time condition monitoring of equipment to prevent failures. That promise only holds when data moves from the machine to a work order without manual steps.
From Raw Data to Actionable Alerts
The flow follows a clear sequence:
- Wireless sensors on equipment capture vibration, temperature, pressure, and electrical load.
- Readings travel over Wi-Fi, cellular, or low-power networks to a gateway or cloud platform.
- Edge or cloud processing cleans noise and extracts features.
- Only threshold breaches or anomalies move forward to the CMMS through an API.
- The CMMS checks incoming values against rules and conditions.
- Satisfied logic triggers a work order, inspection task, or alert.
- Technicians receive contextual tasks.
- Completed work refines thresholds over time.
Detection methods differ in effort and payoff. Threshold-based detection needs little setup and stays easy to read, yet it handles variable conditions poorly. Statistical anomaly detection sits in the middle. Machine learning detection demands substantial historical data and delivers low false positive risk when well configured. Whichever you choose, a high-quality baseline from healthy-asset data anchors the whole system.
Automating Work Order Creation
Automation changes the economics of maintenance. Manual inspection consumes 25-35% of total maintenance resources in overhead, while automated processes cut that to 5-8%. Data entry errors drop by 85-95%. Work completion rates climb from 70-75% to 95-98%. Emergency repairs fall by 30-45%.
Sustained duration logic keeps those gains honest. Require a condition to persist across consecutive readings before the system acts. Pair vibration readings with machine state so alerts stay quiet during idle time. This multi-sensor correlation and early fault detection turn raw signals into trusted work orders.
Calculating ROI and Realistic Timelines
The ROI Formula for Predictive Maintenance
You need a clear formula before you ask for budget. The standard predictive maintenance ROI equation is: (avoided downtime cost + avoided secondary damage + extended asset-life value + reduced reactive labor + reduced spare consumption − program cost) ÷ program cost. A simpler version works too: (annual benefit − annual cost) ÷ annual cost × 100.
Quantify each piece with your own baseline. Record downtime hours, repair expenses, and failure frequency over one year. Multiply hourly production revenue by downtime hours, then add idle labor, overtime, and late-delivery penalties. Proactive fixes cost 4–5x less than emergency repairs. Extended asset life adds another gain: assets under predictive programs last 15–25% longer than reactive or time-based programs. The U.S. Department of Energy reports that a functional program can deliver up to a 10x return, with 25–30% lower maintenance costs, 70–75% fewer breakdowns, and 35–45% less downtime.
Typical Payback Periods and What Drives Them
Most manufacturers hit breakeven within 6–14 months of full deployment, and 27% achieve payback within 12 months. High-cost sectors like automotive or oil and gas regularly see payback in 3–6 months. One prevented major failure can cover an entire year of platform cost.
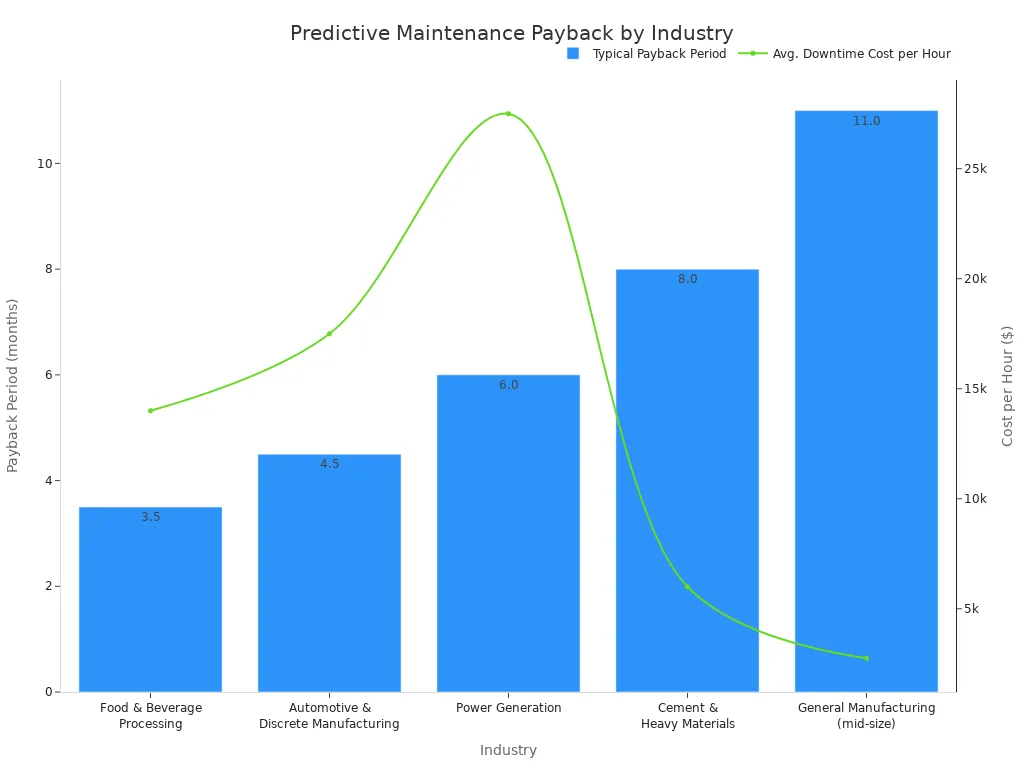
Three factors shorten payback. First, high-criticality assets: define these as assets where a single failure costs more than $10K in downtime or creates a safety event. Start your ROI model on the top 10–20 assets, which typically drive 70–80% of total maintenance costs. Second, an existing CMMS removes integration cost and speeds work order automation. Third, phased deployment spreads fixed costs across more assets over time. Wireless vibration sensors and temperature sensors detect anomalies early, so your first wave of monitored assets usually shows the strongest payback. Later waves extend coverage to assets where the case is less dramatic but still positive.
Your 60-Day Implementation Roadmap
The roadmap has two 30-day phases. Phase one covers assessment. Phase two covers installation and tuning. An iot equipment monitoring project follows this sequence to keep your rollout manageable and results visible.
Days 1–30: Assessment and Pilot Selection
Start by inventorying every asset. Rank each one by criticality using the earlier criteria. Your goal is to identify two to four pilot assets that score highest on failure impact and repair cost.
Next, define your success metrics. Common choices include less unplanned downtime, fewer emergency repairs, and lower costs. Pick the one that matters most. Document your current baseline so you can measure improvement later.
Select pilot assets that are critical but not too complex for your first deployment. A pump or fan on a production line works well. Avoid assets with extreme operating conditions. You want to prove the method before you tackle harder cases.
Days 31–60: Deployment, Baselines, and First Alerts
Mount each wireless sensor securely on the bearing housing. Let the sensors monitor under normal conditions for one to two weeks. This period captures the healthy state of each machine and verifies that each sensor communicates with your iot platform. You build your baseline from real operating data. Include temperature and current readings to capture thermal and electrical health.
Compare the collected data against manufacturer vibration specifications if available. If not, use the average readings from the initial period as your custom baseline.
Now configure your first alert thresholds. Start simple. Use these evidence-based rules:
| Alert Level | Threshold Rule | Purpose |
|---|---|---|
| Early Warning | 20–30% deviation from baseline | Flag trends worth watching |
| Escalation | 50–60% deviation from baseline | Trigger urgent action |
You do not need perfect thresholds on day one. Aim for a starting point and refine later.
Integrate the sensor feed into your CMMS or platform. Map each sensor to the correct asset record. Configure the integration so threshold breaches flow automatically into work orders.
Validate the first alert with a manual inspection. When the system fires its first warning, send a technician to check the machine. Compare what the technician finds to what the system predicted. Use that feedback to tighten or relax thresholds. This validation loop turns raw alerts into trusted maintenance actions.
Remember that this roadmap is a starting framework, not a rigid prescription. Each sensor you deploy adds another layer of protection. Adapt the timing to fit your operations, but keep the sequence intact. Assessment first, then deployment, then refinement. That order protects your investment and builds confidence with every cycle.
Predictive maintenance success comes from pairing multi-sensor technology with a structured plan. You now know the path: core sensors, multimodal coverage, operational context, strategic deployment, CMMS integration, ROI, and a 60-day roadmap. Each step builds on the last.
Single-sensor setups leave blind spots. A vibration reading, a temperature trend, or a current signal alone tells only part of the story. Combine them, and your iot platform sees the whole machine. Follow a phased rollout, and raw data becomes measurable savings.
Start today. Run an asset criticality assessment, then launch your first sensor pilot within 60 days. Small steps now prevent big failures later.
FAQ
Which sensors should I combine for reliable equipment monitoring?
Pair vibration with temperature and current sensing. Vibration catches mechanical faults, temperature reveals friction and overheating, and current exposes electrical strain. Together they close the blind spots each device leaves open. Multi-sensor setups reach 92% accuracy, while single-sensor monitoring trails at 78%.
Why does a single-sensor setup miss failures?
Every sensor type has a blind spot. A bearing fault may show up in vibration data weeks before temperature reacts. Rely on one signal, and you inherit its weakness. You see part of the machine, not the whole picture.
How long until my predictive maintenance program pays for itself?
Most manufacturers reach breakeven within 6 to 14 months. High-cost sectors like automotive and oil and gas often see payback in 3 to 6 months. One prevented major failure can cover a full year of platform cost.
Where should I start my sensor deployment?
Apply the 80/20 rule. Roughly 20% of assets cause 80% of downtime and cost. Rank assets by criticality, failure impact, and repair cost. Instrument your top 20% first, then expand coverage as results prove out.
What alert thresholds should I set on day one?
Start with two tiers. Set an early warning at 20–30% deviation from baseline to flag trends worth watching. Set escalation at 50–60% deviation to trigger urgent action. Refine both thresholds as real alerts come in.
See Also
How AI Predictive Maintenance Will Transform Textile Manufacturing By 2025
Innovative Technologies Revolutionizing Material Handling Operations Across Modern Industries
EDI Tracking Advancements Powering Next Generation Shipment Visibility Solutions
Using AI To Improve Production Forecasting Accuracy: 2024 Enterprise Best Practices
Data Driven Demand Sensing Strategies For Drop Model Businesses